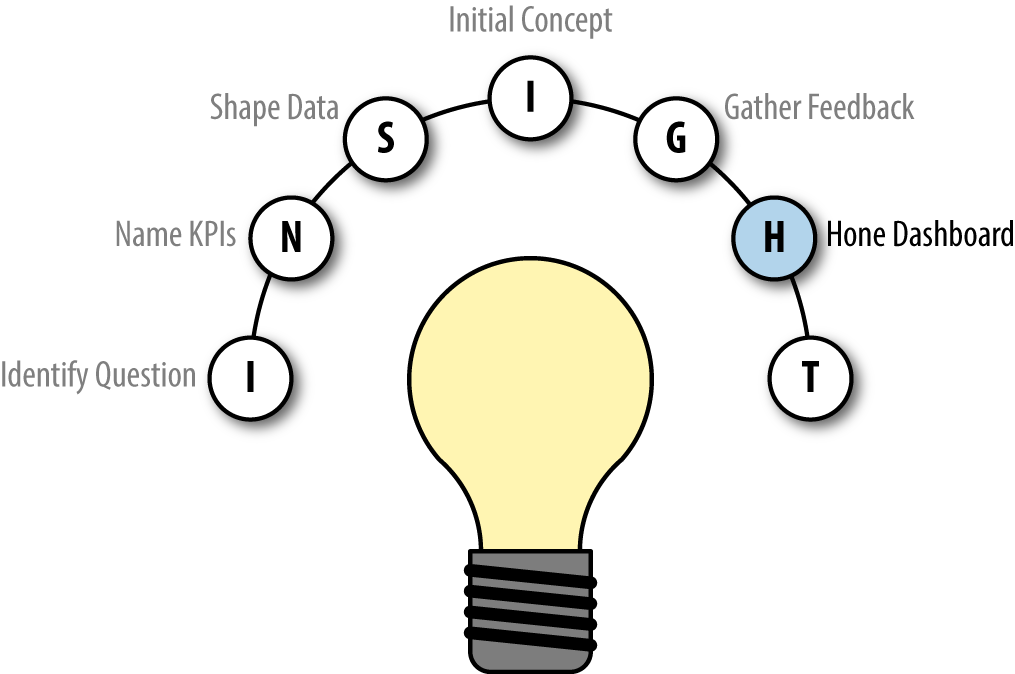
Chapter 82. Hone Dashboard
After gathering feedback from your stakeholders, you are ready to finalize your data visualization. I call this step “hone the dashboard” because you are refining your initial concept based on the audience input provided in the previous step. At this stage in the INSIGHT framework, the business question (or purpose of the data visualization), the KPIs that will be used to answer that business question, and the dataset that contains those KPIs, should all be in a solid—if not final—state:
The task that is left to complete is investing the time to actually build out the components of the dashboard and lay them out. Depending on how much time you invested in the Initial Concept step, you may have quite a bit of effort left to get to a working product. In fact, I recommended that in most situations, the initial concept should have very few working components or even none (in the case that your initial concept was a hand-drawn sketch). While this step leaves quite a bit of work to bring your concept to life, it is much more efficient because you only have to build the dashboard elements once (versus building everything only to have the audience make you move in a completely different direction).
While there is no one best way to create a dashboard, here are a few general rules I have in the back of my mind when trying to finalize a view:
-
Dashboard dimensions ...
Get Practical Tableau now with the O’Reilly learning platform.
O’Reilly members experience books, live events, courses curated by job role, and more from O’Reilly and nearly 200 top publishers.

