Chapter 40. How to Make Funnel Charts
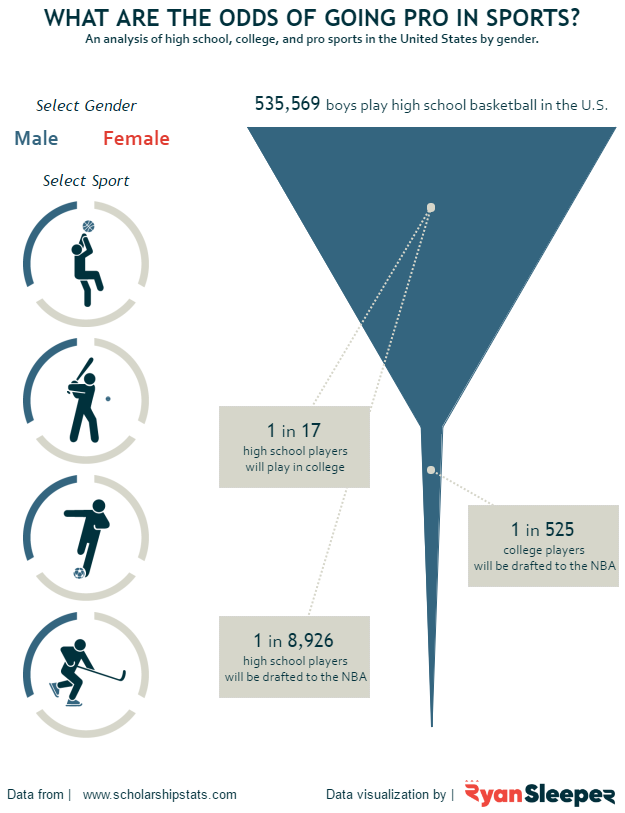
The Odds of Going Pro In Sports viz has generated more questions around how it was created than any other viz I have put together during my career with Tableau. With its one dominant funnel chart and icon-based navigation, the viz tells the story about the share of high school athletes progressing to the college and pro levels across several sports for each gender.
The most common question I receive: That was made in Tableau? I would be lying if I said that question doesn’t make me want to stand up a little taller, but the secret is, the viz was one of the easiest dashboards I have ever put together. In fact, I put it together in a couple of hours on a Sunday afternoon. Funnel charts are one of the simplest chart types you can create, but they have proved to be incredibly effective in a corporate setting—think conversion rates and customer flows. This chapter will walk you through multiple approaches to creating funnel charts.
First, let’s take a look at the full version of What are the odds of going pro in sports?
How to Make Funnel Charts in Tableau
Option 1: The Step Dimension
Going into this project, I knew that I wanted the main view to be a funnel chart. For this reason, I was able to plan ahead and put the data in an optimal format for Tableau. Here is a sample of the underlying data:
Note that there is a dimension called Step, ...
Get Practical Tableau now with the O’Reilly learning platform.
O’Reilly members experience books, live events, courses curated by job role, and more from O’Reilly and nearly 200 top publishers.

