Chapter 35. How to Make Custom Polygon Maps
In the last two tutorials about mapping, we have discussed path maps (in Chapter 33) and custom symbol maps (in Chapter 34). There is a third type of map in Tableau called a polygon map that allows you to map custom shapes. These types of visualizations are what we’re making anytime we’re making a filled map. Imagine a map of sales by US state where each state is colored by their respective sales volumes, something we’ve done before. With these filled maps, Tableau is essentially looking up the latitude and longitude coordinates all the way around the border of each state, and plotting a custom polygon for each territory. With custom polygons, we’re not limited to a prepared set of polygons like state borders—we can define shapes for anything we can imagine from custom geographic dimensions, to your favorite theme park, to your local dog park, to grocery store shelves, or anything else!
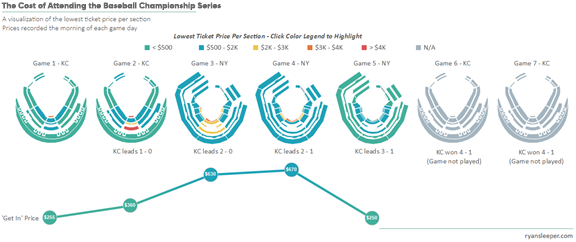
This tutorial will use one of my most asked-about visualizations, The Cost of Attending the Baseball Championship Series, to illustrate how you can create custom polygon maps with any shapes—including stadiums!
First, let’s take a look at the screenshot of the original viz:
Polygon maps in Tableau are created by looking up the coordinates of the shape you want to draw, and then connecting the dots by drawing a path between them. I encourage you to read ...
Get Practical Tableau now with the O’Reilly learning platform.
O’Reilly members experience books, live events, courses curated by job role, and more from O’Reilly and nearly 200 top publishers.

