Chapter 30. How to Make a Symbol Map with Mapbox Integration
Maps, which were introduced with Tableau 4.0 in August 2008, are one of the most powerful visualization types available. The power of maps comes from their inherent ability to leverage schemas that your users have been building up for many years. In Chapter 98, I’ll show how an image of a map helps you decode dozens of latitude/longitude pairs almost instantly.
The next several chapters cover different map types you can create with Tableau and their purposes. The first shares how to harness this power by creating symbol maps and how to take your maps a step further by integrating Tableau with Mapbox maps.
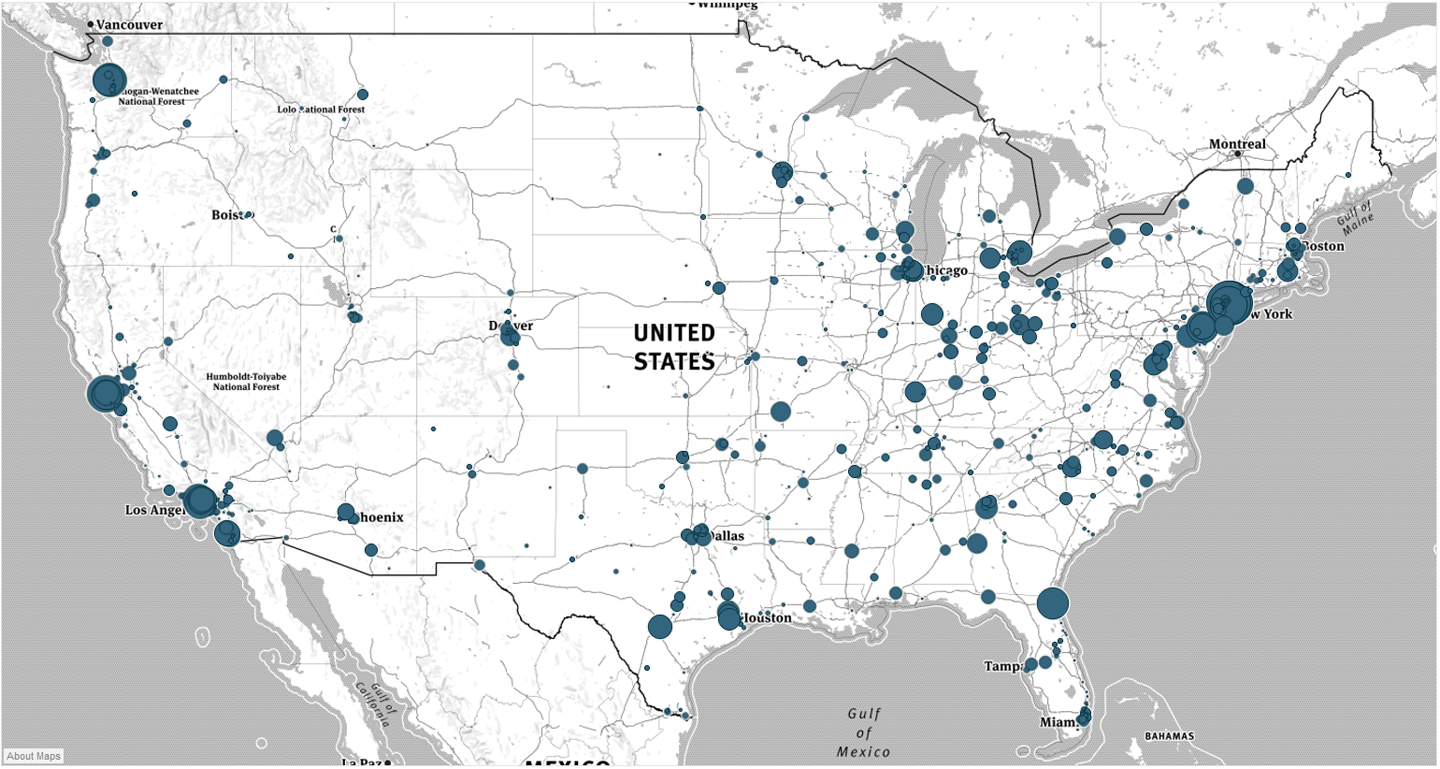
First, let’s take a look at how my final map example will look:
How to Make a Symbol Map in Tableau
The easiest way to start a symbol map in Tableau is to double-click a geographic dimension from the Dimensions area of the Data pane on the left side of the interface. You know that Tableau recognizes your geographic fields as map-compatible if there is a globe icon next to the dimension. In my example, I am going to double-click Postal Code in the Sample – Superstore dataset to start the view:
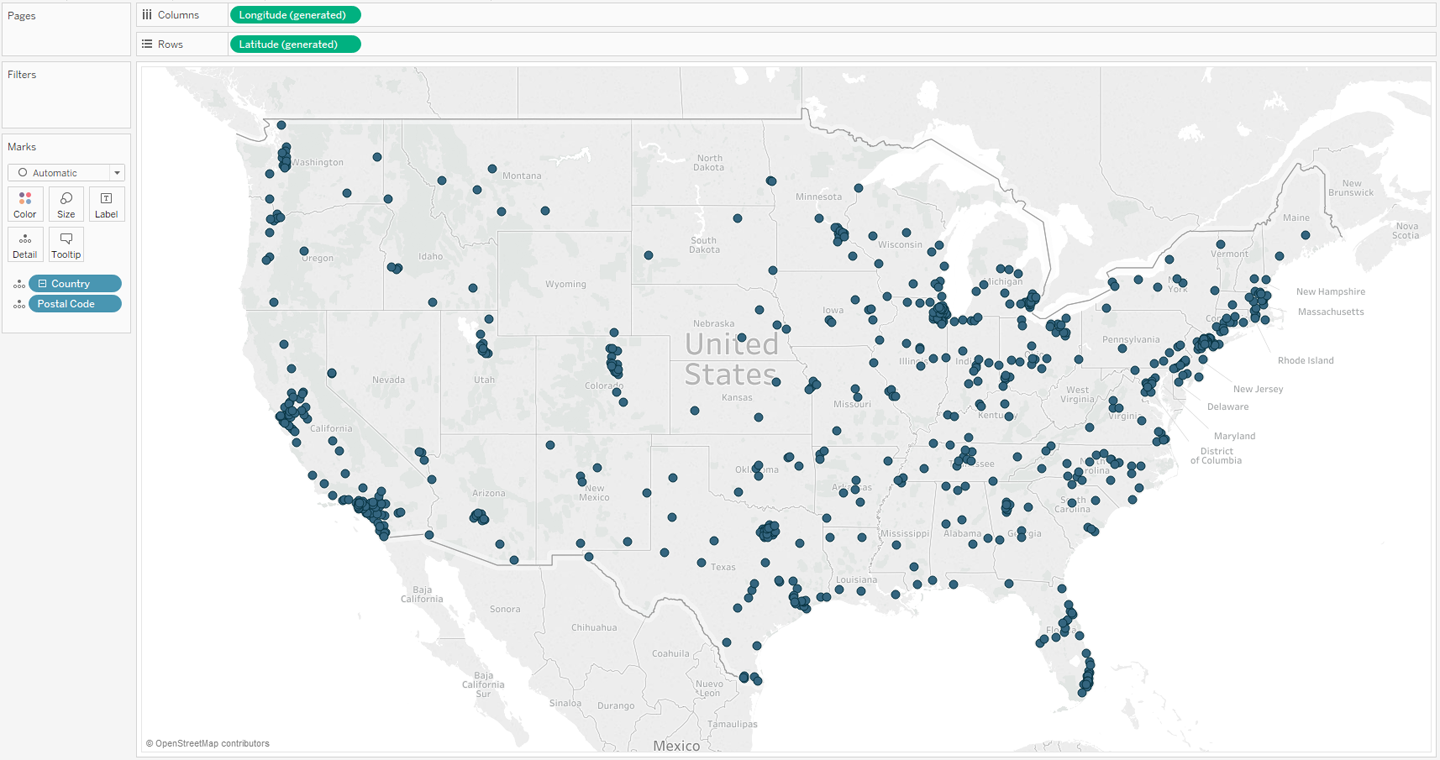
Notice that Tableau put Longitude on the Columns Shelf and Latitude on the Rows Shelf, and each circle represents the intersection ...
Get Practical Tableau now with the O’Reilly learning platform.
O’Reilly members experience books, live events, courses curated by job role, and more from O’Reilly and nearly 200 top publishers.

