Chapter 17. An Introduction to Dashboards and Distribution
Individual worksheets in Tableau can lead to powerful insights that help your business, but many times, it makes sense to combine the worksheets into a single dashboard. By combining varying visualizations into a dashboard, you and your audience are able to analyze different aspects of the data in context of each other. This is a much more intuitive experience than viewing the visualizations individually.
In addition to this one obvious benefit, Tableau comes with several technical features that allow you to control the user experience and even the ability to have the individual components of the dashboard interact with each other. This chapter offers an introduction to dashboards in Tableau and several ways to distribute the dashboard after it has been created.
An Introduction to Dashboards in Tableau
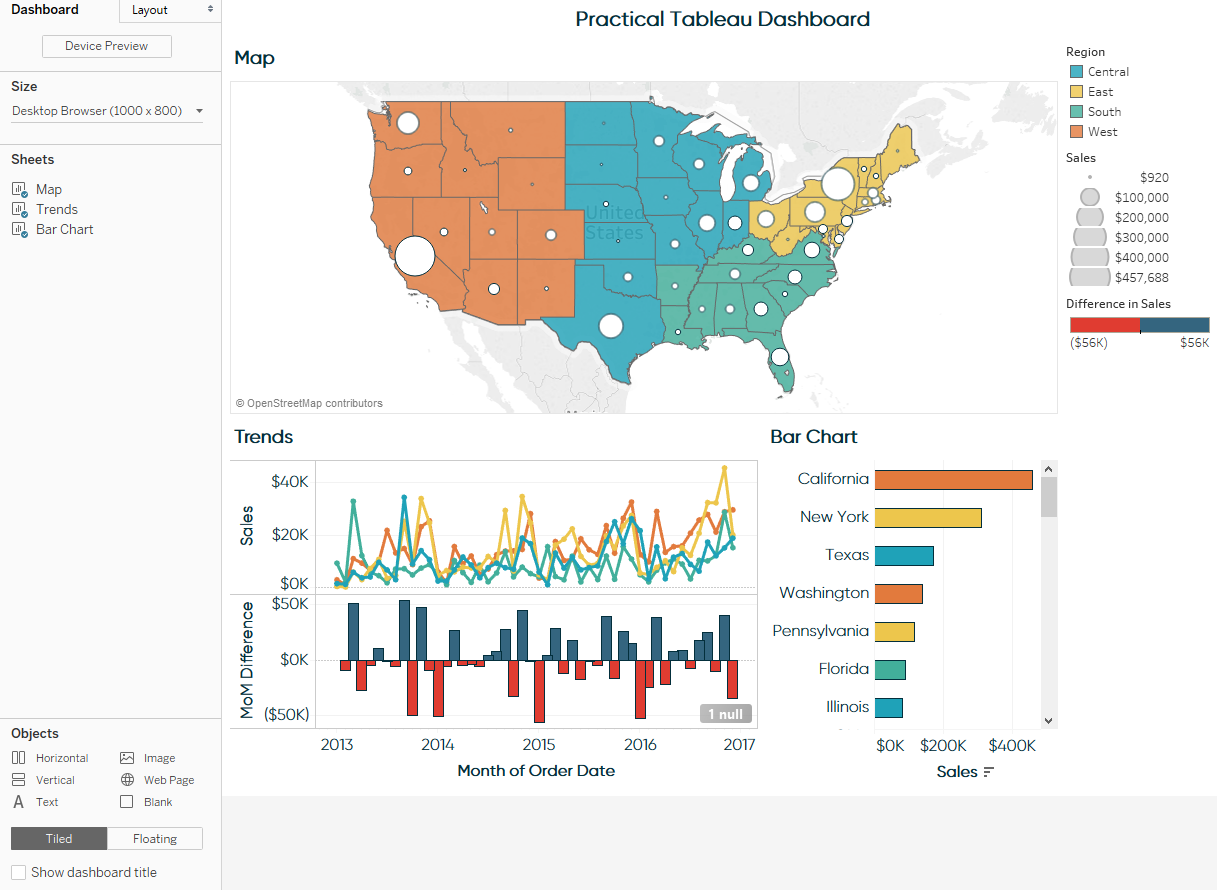
For this introduction, we will re-create this dashboard in Tableau:
To create a new dashboard in Tableau, either click Dashboard in the top navigation and then New Dashboard or click the New Dashboard icon at the bottom of any worksheet. The New Dashboard icon is the second icon immediately following the existing worksheets in the workbook.
Upon creating a new dashboard, you will be provided a blank slate that looks like this:
Here’s a quick overview of all the different dashboard options in the left navigation:
Get Practical Tableau now with the O’Reilly learning platform.
O’Reilly members experience books, live events, courses curated by job role, and more from O’Reilly and nearly 200 top publishers.

