Chapter 11. An Introduction to Filters
Tableau provides the ability to filter individual views or even entire data sources on dimensions, measures, or sets (see Chapter 15). This filtering capability can serve a variety of purposes, including minimizing the size of the data for efficiency purposes, cleaning up underlying data, removing irrelevant dimension members, and setting measure or date ranges for what you want to analyze. What’s more, most of these filters can be manipulated by you and your end users—a powerful tactic for finding stories in the data. This chapter offers an introduction to filters in Tableau, including extract filters, data source filters, dimension filters, and measure filters.
Dimension Filters in Tableau
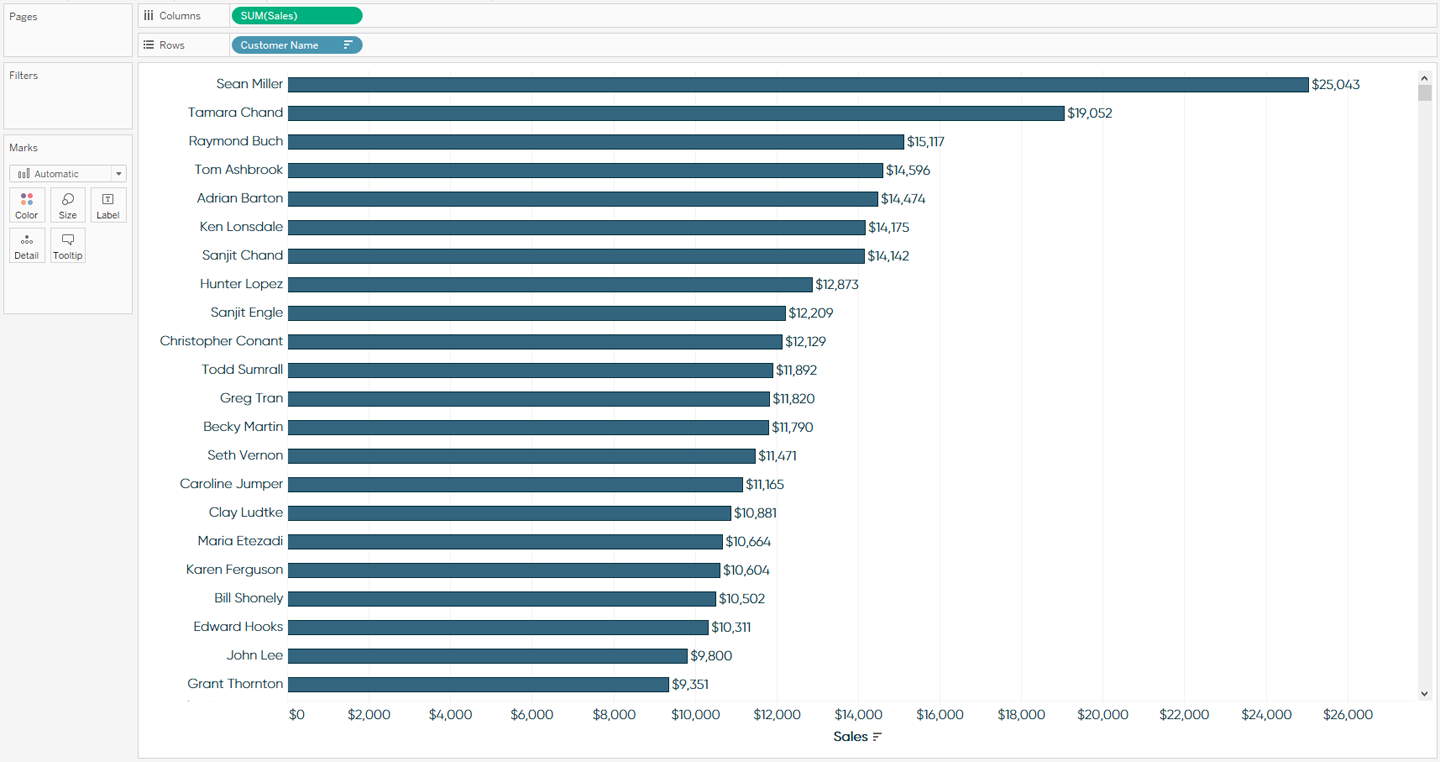
For this chapter, we will start with the most granular filters (dimension filters and measure filters) and then work our way out to the more “macro” filters. To help illustrate dimension filters and measure filters, we will use this simple bar chart, which is showing the sales per customer from the Sample – Superstore dataset in descending order (the customer names are sorted in descending order by sum of Sales; one way to achieve this is by clicking the sort descending icon found immediately above the Columns Shelf):
The first, and most basic way to filter out marks on a view, is to select the marks, and then choose to keep or exclude them. Let’s ...
Get Practical Tableau now with the O’Reilly learning platform.
O’Reilly members experience books, live events, courses curated by job role, and more from O’Reilly and nearly 200 top publishers.

