The OllyDbg Interface
As soon as you load a program into OllyDbg, you will see four windows filled with information that you will find useful for malware analysis, as shown in Figure 9-2.
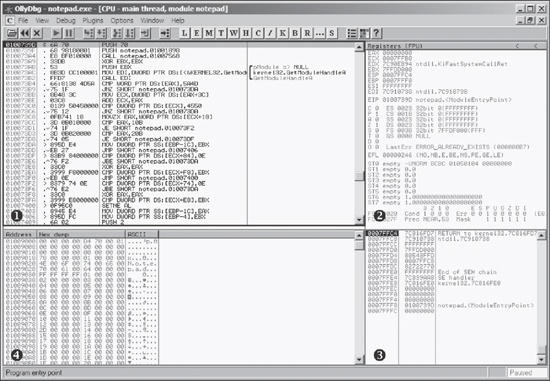
Figure 9-2. The OllyDbg interface
These windows display information as follows:
Disassembler window ❶. This window shows the debugged program’s code—the current instruction pointer with several instructions before and after it. Typically, the next instruction to be executed will be highlighted in this window. To modify instructions or data (or add new assembly instructions), press the spacebar within this window.
Registers window ❷. This window shows the current state ...
Get Practical Malware Analysis now with the O’Reilly learning platform.
O’Reilly members experience books, live events, courses curated by job role, and more from O’Reilly and nearly 200 top publishers.

