Chapter 2. The Shape of Anomaly Detection
The exciting thing about anomaly detection is the sense of discovery. You need a program that can spot what is unusual, so anomaly-detection models are on the lookout for the outliers. To get a sense of how this works, try a simple human-scale example, such as the one shown in Figure 2-1. Can you spot an outlier?
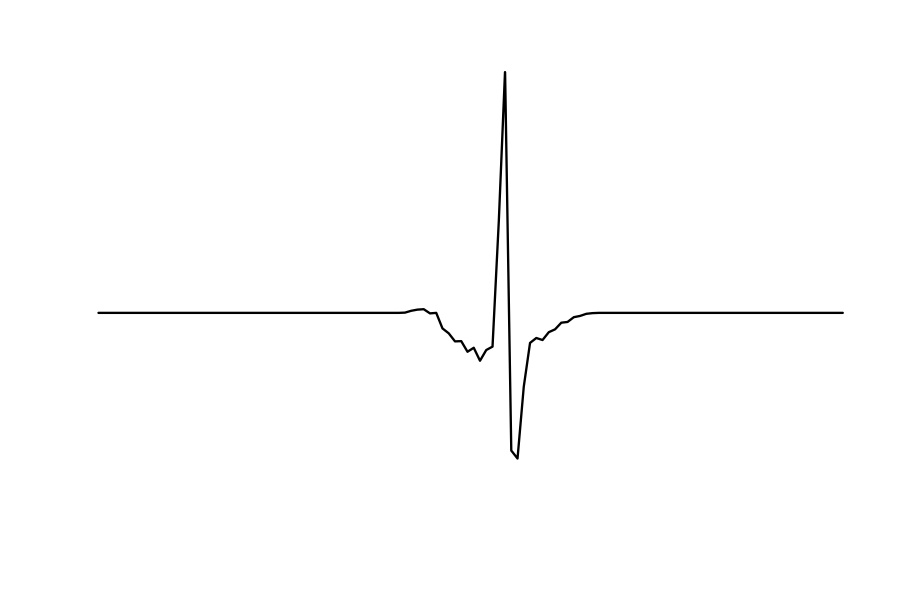
Despite the fact that there is apparent noise in the data of the horizontal line shown in Figure 2-1, when you see data like this, it’s fairly easy to see that the large spike appears to be an outlier. But is it?
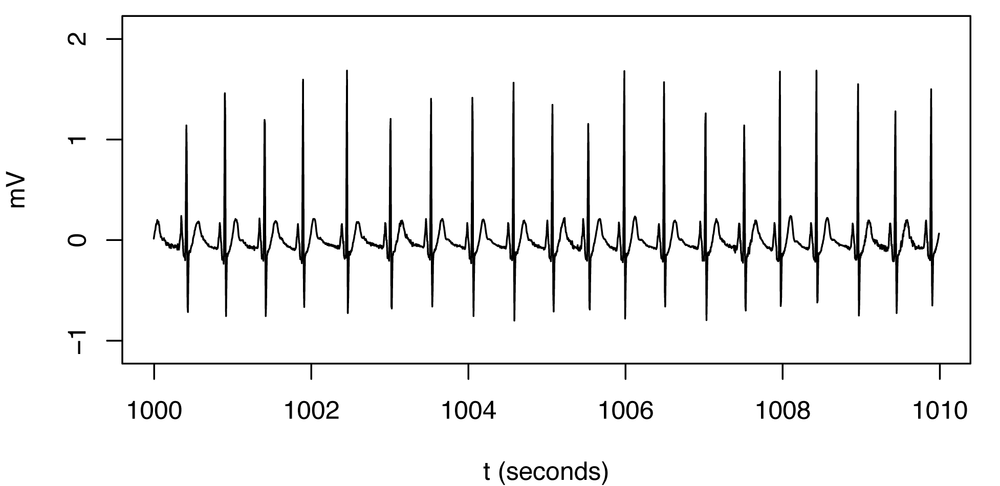
What happens when you have a larger sample of data? Now your perception changes. What had appeared to be an anomaly turns out to be part of a regular and even familiar pattern: in this case, the regular frequency of a normally beating heart, recorded using an EKG, as shown in Figure 2-2.
There’s an important lesson here, even in this simple small-scale example:
Before you can spot an anomaly, you first have to figure out what “normal” is.
Discovering “ normal” is a little ...
Get Practical Machine Learning: A New Look at Anomaly Detection now with the O’Reilly learning platform.
O’Reilly members experience books, live events, courses curated by job role, and more from O’Reilly and nearly 200 top publishers.

