Residual Analysis in the Fit Model Platform
The Fit Model platform automatically generates a plot of Residuals versus Predicted (Fitted) value, as shown in Figure 15.7. We interpret this graph just as we did in Chapter 14. We see some indication of heteroskedasticity: the points are concentrated closer to the zero line on the left side of the graph, and drift away from zero as we move to the right.
Figure 15.7. Residual Plot for First Compressive Strength Model
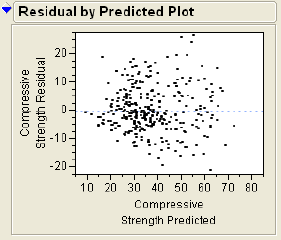
We might be able to come closer to a homoskedastic pattern by including more variables in the model, or by using some approaches illustrated later in Chapter 16. Stay tuned.
|
JMP does ... |
Get Practical Data Analysis with JMP® now with the O’Reilly learning platform.
O’Reilly members experience books, live events, courses curated by job role, and more from O’Reilly and nearly 200 top publishers.

