Let's take a look at how an image can be visualized with the following code:
#import all required libimport matplotlib.pyplot as plt%matplotlib inlineimport numpy as npfrom skimage.io import imreadfrom skimage.transform import resize
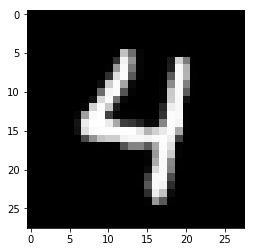
# Load a color image in grayscaleimage = imread('sample_digit.png',as_grey=True)image = resize(image,(28,28),mode='reflect')print('This image is: ',type(image), 'with dimensions:', image.shape)plt.imshow(image,cmap='gray')
We obtain the following image as a result:
def visualize_input(img, ax): ax.imshow(img, cmap='gray') width, height = img.shape thresh = img.max()/2.5 for x in ...

