Chapter 6. Creating Histograms and Normal Distribution Plots with Python
Python is a general-purpose programming language that was created in the late 1980s. So, while it has been around for quite a while, it has experienced a popularity surge of late, especially within the data science and data visualization communities. In fact, in a 2016 study performed by CodeEval found that Python was the most popular coding language, as seen in the following screenshot:
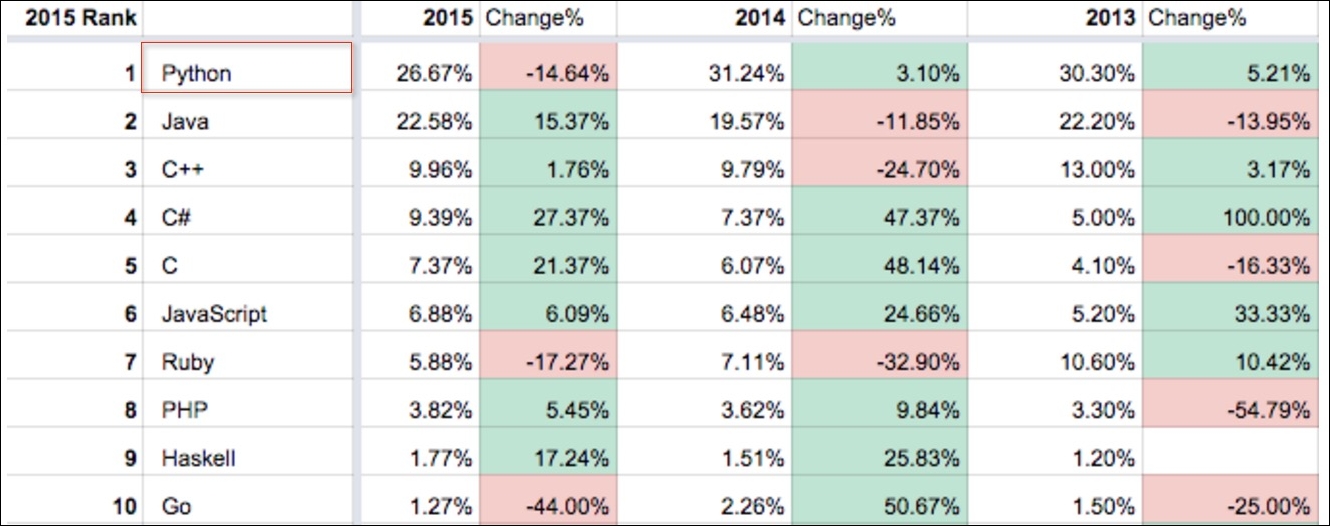
The full evaluation of all the coding languages, as well as the methodology for ranking the study used, can be found at the following website: http://blog.codeeval.com/codeevalblog/2016/2/2/most-popular-coding-languages-of-2016 ...
Get Practical Business Intelligence now with the O’Reilly learning platform.
O’Reilly members experience books, live events, courses curated by job role, and more from O’Reilly and nearly 200 top publishers.

