Time series forecasting in R
A time series graph is one that evaluates activity over a period of time. A more specific time series plot can be generated using the ts() and plot.ts() functions in R, as seen in the following scripts:
Query1_TS<-ts(SQL_Query_1$Discount)
plot.ts(Query1_TS, xlab = 'Week (1-52)', ylab = 'Discount', main = 'Time Series of Discount Code by Week')
The output of the time series script can be seen here:
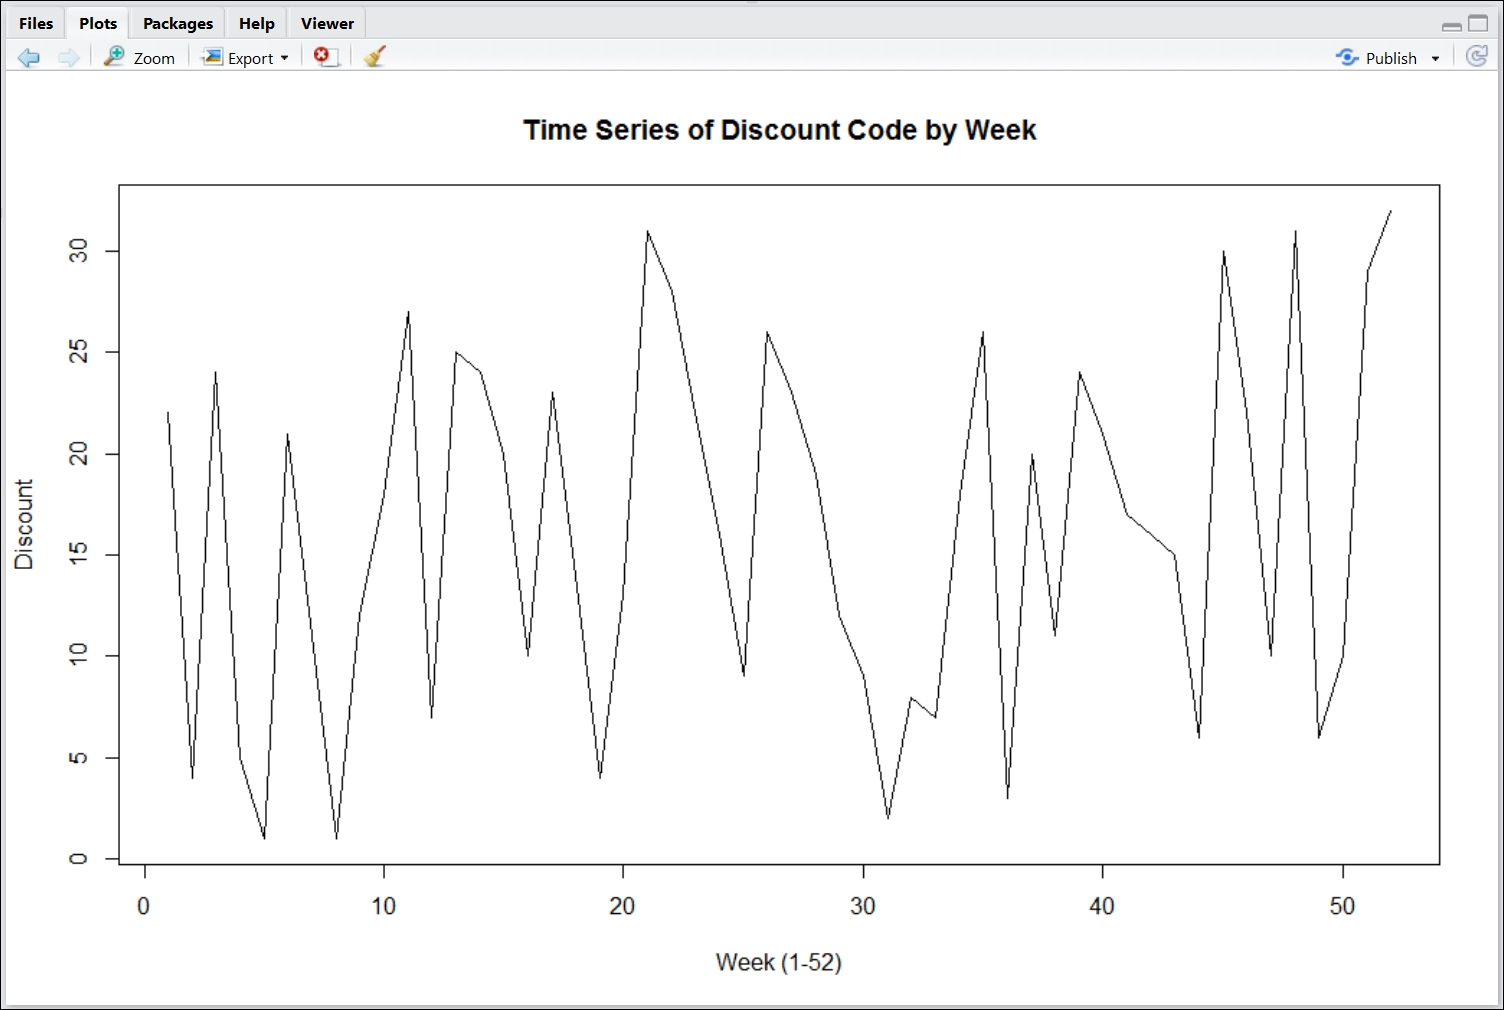
At first glimpse, the time series plot looks no different from earlier line charts developed in this chapter. The difference lies within the inherent qualities of a time series plot, which allows you to view activity over specified ...
Get Practical Business Intelligence now with the O’Reilly learning platform.
O’Reilly members experience books, live events, courses curated by job role, and more from O’Reilly and nearly 200 top publishers.

