A handy technique that the dashboard gives us is the ability to adjust the display range of all the graphs at the same time. If we click on Relative Time Range in the top menu, this pop-up appears:
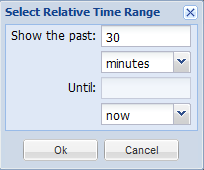
With this, we can observe the past few minutes, hours, days, weeks, or months of data trends for every graph currently being displayed. This functionality is further extended in the Absolute Time Range menu, which allows us to choose any date or time range since we installed Graphite.
Explore further to fully leverage the dashboard view!

