APPENDIX H
The Last Triangle
Dating back to the Civil War, the Axe-Houghton Industrial Stock Price Average was still in common use before the Dow Jones Industrial Average came into being in the early part of the 1900s. It used a different method of weighting and included a slightly different mix of stocks. It is clear from a study of this index that a long-term bull market cycle, now referred to as a Krondratieff Wave, had been in place since the Panic of 1857, where the Axe-Houghton traded briefly below 10, climbing to a high in late 1919 of just over 210.
From this high in 1919, the Axe-Houghton Industrial Average fell back into a triangle that took nearly five years to complete, as seen in Figure H.1.
Figure H.1 The Great Crash of 1929
Source: H. M. Gartley, Profits in the Stock Market (Pomeroy, WA: Lambert Gann Publishing, 1935).
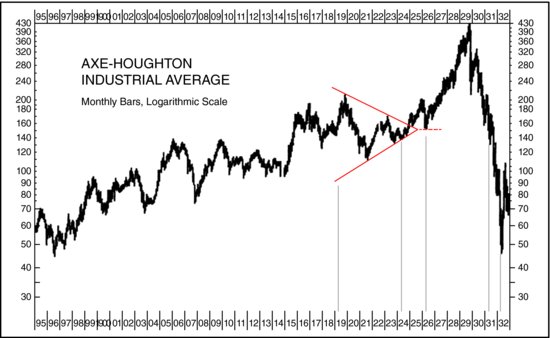
On very close examination, in mid-1924, price action briefly made a false breakout to the downside of that triangle. But by the end of the year, prices had successfully reversed and were pushing out the upside of the triangle, back in sync with the long-term bull.
After rallying for more than a year, price broke sharply, and in mid-1926 fell in a straight vertical drop back down to the apex of the triangle, losing 25 percent of its value to around 150. The apex repelled the decline, and for the next three-and-a-half years until October 1929, prices ...
Get Pivots, Patterns, and Intraday Swing Trades: Derivatives Analysis with the E-mini and Russell Futures Contracts, + Website now with the O’Reilly learning platform.
O’Reilly members experience books, live events, courses curated by job role, and more from O’Reilly and nearly 200 top publishers.

