APPENDIX G
Fibonacci versus Pivot/Exhaustion Grid
While I was writing this book, I got an e-mail solicitation for a webinar on Fibonacci trading techniques from a protégé of Robert Miner. I had studied his work and used his software many years earlier, but found the results disappointing for intraday trading of the stock index futures in the lower time frames. As discussed in Chapter 3, I still use a Fibonacci targeting rule as part of a Trade Entry Model. Out of curiosity, I attended the webinar. As a Trader, I'm a perpetual student. Always keep an open mind.
Already familiar with the techniques employed, I was reminded instead what gymnastics are engaged in order to establish an authority and credibility on market science. But isn't it perhaps already in the charts for us to understand, if only we open ourselves up to more simple observations?
The stock chart of DTV in daily bars was used for the webinar I attended, and a copy of it in Figure G.1 displays a cluster of the three targeting techniques employed. (Study Figure G.1 here, or visit the Wiley companion website for a colorized version of the Figures in Appendix G.)
Figure G.1 Fibonacci Cluster of Three Methods
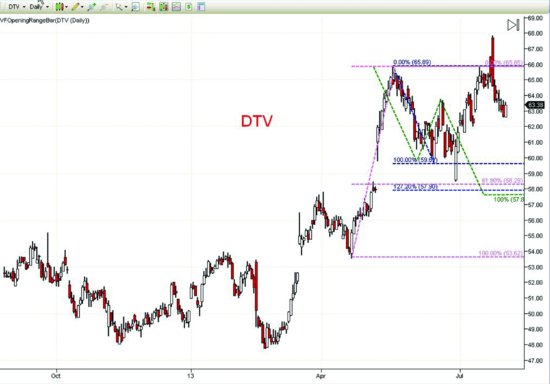
The pink dashed lines plot a retracement sell-off of 61.8 percent from the high of 66 as measured from the low of 53.62. The blue dashed lines represent the 1.272 percent extension of that same sell-off, past the ...
Get Pivots, Patterns, and Intraday Swing Trades: Derivatives Analysis with the E-mini and Russell Futures Contracts, + Website now with the O’Reilly learning platform.
O’Reilly members experience books, live events, courses curated by job role, and more from O’Reilly and nearly 200 top publishers.

