A Sample GD::Graph Application
As an example of using GD::Graph, we’ll implement a web-based biorhythm server. The general idea of biorhythms is that cyclic processes in nature (seasonal changes, and particularly the changing phases of the moon) are reflected in the processes of the human body. Although they have no real basis in scientific study, these cyclic patterns have captured people’s imaginations for years. You can even get your biorhythm read by coin-operated machines at many rest stops on America’s highways.
Here’s how the biorhythm server works. First, a user enters her birth date, and a range of dates for the biorhythm report. These are submitted via a CGI script to a Perl script that creates a graph for the three primary biorhythm patterns: physical, emotional, and intellectual. These three patterns unfold as sine waves starting from the date of birth, with periods of 23 days for the physical cycle, 28 days for the emotional cycle, and 33 days for the intellectual cycle. The biorhythmic cycles are defined based upon these numbers.
The biopage.cgi script (Example 4-1) builds the HTML page, including the form used to enter the data for the script. It then passes the data to the biorhythm.cgi script (Example 4-2), which uses the GD::Graph module to create a biorhythm chart from the data and sends it to the browser as a PNG image data stream. The biopage.cgi script is accessed for the first time without any data fields with the URL http://www.yoururl.com/cgi-bin/biopage.cgi.
#!/usr/local/bin/perl
#
# Example 4-1. biopage.cgi
#
use GD;
use CGI;

# First get the parameters passed into the script
# Use the CGI module to parse the CGI form submission.

my $q = new CGI;
my $dob = $q->param('dob');
my $start = $q->param('start');
my $end = $q->param('end');

# Use the CGI module to create the HTML for the page
# Print the header and opening tags

print $q->header(-type => 'text/html');
print $q->start_html(-title => "Biorhythm!");

if ($dob && $start && $end) {

    # Output the html for the image tag. This passes the data
    # on to the bio.cgi script to generate the image data.

    print $q->h1("Your biorhythm from $start to $end");
    print $q->img({ src => "biorhythm.cgi?".
                           "dob=$dob&start=$start&end=$end",
                    width => 500, height => 300 });
    print $q->br;

} else {

    # In this case, no data has been passed to the script; this
    # may be because this is the first invocation of the script or
    # blank fields were submitted. We can just print an
    # appropriate headline...

    print $q->h1('Get your biorhythms here!');
}

# Print the form used to enter the dates

print $q->start_form({ method => 'post',
                       action => 'biopage.cgi' }),

      "Date of Birth:",

      $q->input({ type => 'text',
                  name => 'dob',
                  size => 10,
                  value => $dob }),

      "Calculate biorhythms from  ",

      $q->input({ type => 'text',
                  name => 'start',
                  size => 10,
                  value => $start }),
      " to ",

      $q->input({ type => 'text',
                  name => 'end',
                  size => 10,
                  value => $end }),
      $q->input({ type => 'submit',
                  value => 'Give me my biorhythm!' }),
      $q->end_form( ),
      $q->end_html( );
The HTML page that is output from this script is shown in Figure 4-4.
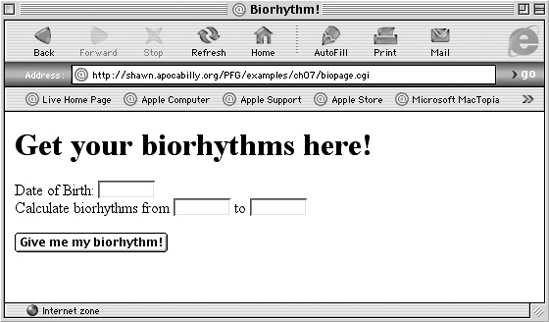
When a user enters data into the form fields and hits the Submit button, the biopage.cgi script is called again with the new data. Assuming the user has entered valid data, it creates a new HTML page with an embedded IMG tag that calls the biorhythm.cgi script to generate the graph.
The biorhythm.cgi script (Example 4-2) is the one that actually does the graphical grunt work. It uses the GD::Graph::bars module to plot the bar graph, and the Date::Calc module to perform the required date calculations. Date::Calc must be installed on the system running the script.
The script first uses the CGI module to get the date of birth, start date, and end date parameters that were passed from the form. It then calculates the number of days between the start and end dates and the number of days between the date of birth and the start date.
#!/usr/local/bin/perl -w
#
# Example 4-2. biorhythm.cgi

use GD::Graph::bars;
use Date::Calc;
use CGI;

# We'll need a good value for Pi later

my $pi = 4 * atan2(1,1);

my $query = new CGI;
my @dob = Date::Calc::Decode_Date_US($query->param('dob'));
my @start = Date::Calc::Decode_Date_US($query->param('start'));
my @end = Date::Calc::Decode_Date_US($query->param('end'));

my $days = Date::Calc::Delta_Days(@start, @end);
my $dobdiff = Date::Calc::Delta_Days(@dob, @start);

my @xvalues;

foreach my $day (0..$days) {
    # Add_Delta_days returns a date offset from the start date.
    # It returns a list in the form (yyyy, mm, dd)

    push @xvalues, (Date::Calc::Add_Delta_Days(@start,$day))[2];
}
The output of this script is shown in Figure 4-5.
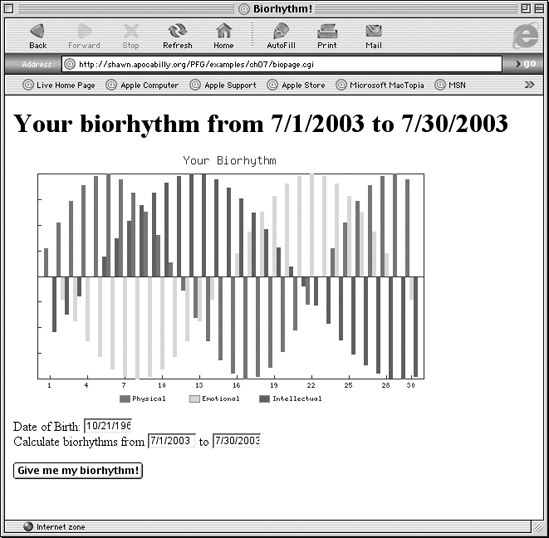
The algorithm for creating the data set is relatively simple.
Because the sine function starts at y=0 for the user’s date of birth
and continues oscillating through its cycle as time advances, the
function has a certain starting value at the starting date of the
range. The offset value is the number of days that the function has
progressed into its cycle at the date indicated by $start. It can be calculated by finding the
difference between the start date and the date of birth, dividing by
the period, and taking the remainder.
The period of the sine wave for the p, e, and
i sets are 23 days, 28 days, and 33
days, respectively. To compute the value at a particular day, we must
first “shift” the sine wave to get the correct starting value, instead
of computing every value from the person’s birth date to the present.
This shift is accomplished by adding the remainder of $dobdiff divided by the period of the wave
as an offset. Note that the sin( )
function expects a value expressed in radians:
my (@pvalues, @evalues, @ivalues);

foreach my $count (0..$days) {
    push @pvalues, sin((($count+($dobdiff % 23))/23) * 2 * $pi);
    push @evalues, sin((($count+($dobdiff % 28))/28) * 2 * $pi);
    push @ivalues, sin((($count+($dobdiff % 33))/33) * 2 * $pi);
}

# Create a new bar graph

my $graph = new GD::Graph::bars(500,300);
Next, set the attributes. The y values represent nonquantitative
“good” and “bad” values, so we won’t plot numerical values on the y
axis. Since we are using a bar graph, we want the x-axis labels along
the bottom edge of the graph so it doesn’t get messy (zero_axis_only).
# Set the attributes for the graph

$graph->set(
    x_label           => '',          # No labels
    y_label           => '',
    title             => 'Your Biorhythm',
    y_plot_values     => 0,
    y_max_value       => 1,           # sine range is −1 to 1
    y_min_value       => −1,
    y_tick_number     => 8,
    long_ticks        => 0,           # use short ticks on axes
    x_label_skip      => 3,           # print every third x label
    zero_axis         => 0,
    zero_axis_only    => 0,
);

# Add the legend to the graph

$graph->set_legend('Physical', 'Emotional', 'Intellectual');

# Plot the graph and write it to STDOUT

print STDOUT $query->header(-type => 'image/png');
binmode STDOUT;                      # switch to binary mode
my $gd = $graph->plot( [ \@xvalues,
                         \@pvalues,
                         \@evalues,
                         \@ivalues ] );
print STDOUT $gd->png;
You should now have a workable biorhythm server at this point—something every web site should have!
Get Perl Graphics Programming now with the O’Reilly learning platform.
O’Reilly members experience books, live events, courses curated by job role, and more from O’Reilly and nearly 200 top publishers.

