442 Patterns: Implementing Self-Service in an SOA Environment
stack tracing
standard tracing
debug tracing
JNI tracing
JNI tracing is usually the most useful of all traces. It is the JNI level between the
Java CICS TG and the native EXCI or CICS client.
The application can enable tracing programmatically. It can also be enabled
dynamically in the Gateway daemon using the TCPAdmin protocol handler, or
statically as a start option. CICS TG trace is recorded in the standard output file
or standard error file.
External CICS Interface trace
The External CICS Interface (EXCI) provides a programming interface for the
non-CICS address space to invoke CICS programs. CICS TG utilizes EXCI to
communicate with the CICS program. The CICS Transaction Gateway writes
trace entries to the EXCI trace when it issues an EXCI request. The trace entries
in a dump can be printed using standard z/OS utilities (GTF).
CICS trace
CICS Transaction Server provides a facility for recording CICS activity. In CICS
for MVS™, there are three destinations for trace entries: Internal trace, auxiliary
trace, and generalized trace facility (GTF).
12.6.2 Performance monitoring and tuning
In this section we briefly look at performance monitoring and tuning for J2EE
Connectors in WebSphere Application Server V6.0.
Using Tivoli Performance Viewer
The Tivoli Performance Viewer is a graphical performance monitor for
WebSphere Application Server V6. This can be accessed through the
WebSphere administrative console by selecting Monitoring and Tuning →
Performance Viewer. You can use the Performance Viewer to retrieve
performance data from application servers. Data is collected continuously by
application servers and retrieved as needed from within the Viewer.
You can regulate the impact of data collection by modifying the PMI settings.
These settings can be found viewed and modified by selecting Monitoring and
Tuning → Performance Monitoring Infrastructure (PMI). The counters in the
JCA Connection Pools category provides information about J2EE connectors,
such as the number of managed connections (ManagedConnections) and the
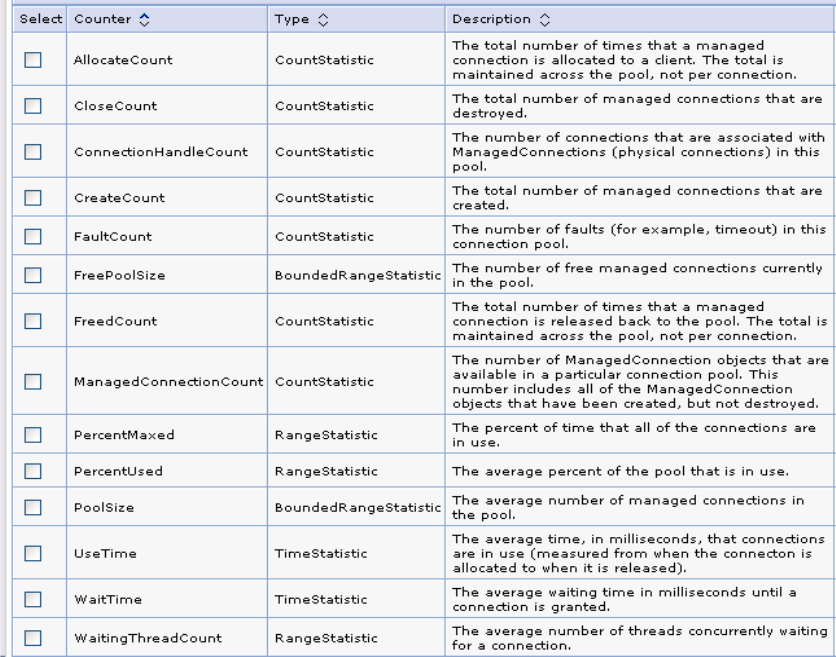
Chapter 12. J2EE Connector Architecture scenario 443
number of connection handles (connections). Figure 12-32 shows the PMI
options available under JCA connection pools.
Figure 12-32 Tivoli Performance Viewer JCA connection pool options
Tuning connection pooling properties
There are several parameters you can set to optimize connection pooling
properties using the WebSphere administrative console:
Connection timeout
This is the number of milliseconds after which a connection request is
determined to have timed out and a ResourceAllocationException is thrown.
The wait might be necessary if the maximum value of connections has been
reached (MaxConnections). This value has no meaning if the maximum
connections property has not been set.
Get Patterns: Implementing Self-Service in an SOA Environment now with the O’Reilly learning platform.
O’Reilly members experience books, live events, courses curated by job role, and more from O’Reilly and nearly 200 top publishers.

