384 Patterns: Implementing Self-Service in an SOA Environment
11.6 System management for JMS
This section takes a brief look at system management issues when using JMS
applications.
11.6.1 JMS performance issues
Some issues that play a role in JMS messaging performance are:
Generic versus specific message structure
Making the message structure more generic requires more translation and
interpretation time at the sender and receiver ends. Making a message too
specific reduces flexibility for even small changes in the message structure.
Remember to create an error queue for messages that cannot be validated.
Message persistence
Using persistent messages requires writing the messages to disk, which
takes time, reducing performance.
Request/reply scenario
In a request/reply scenario, it is important that the issue of blocking calls is
dealt with correctly. Essentially, EJBs should only be used with appropriate
request/reply timeouts and retries.
Message-driven bean
Minimize the time spent in a message-driven bean processing the message.
This will make message-driven bean processing faster. Let the pool of
message-driven beans depend on the number of messages that arrive at the
queue.
Optimization with connection
Start the connection when appropriate so that consumers are ready to
consume messages before the producers are started. Also process
messages concurrently using a server session pool for the processing of the
messages. Close the connection when you are finished consuming
messages.
11.6.2 Performance monitoring for mediations
When PMI is enabled, the following information is collected for each mediated
destination:
Mediation time is the time taken to perform the mediation.
Messages mediated is the number of messages mediated at this destination.
Chapter 11. JMS scenario 385
Thread count is the number of threads in the mediation thread pool
performing work for the mediation.
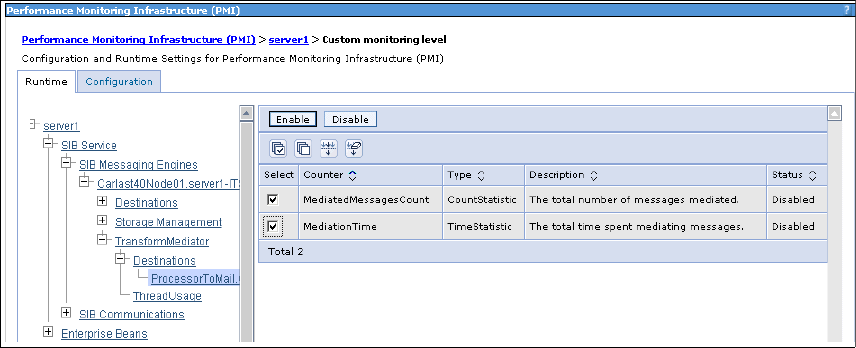
To enable these counters, perform the following tasks:
1. Select Monitoring and Tuning → Performance Monitoring Infrastructure
(PMI).
2. Click the server name.
3. Click the Runtime tab.
4. Click Custom.
5. Expand SIB Service → SIB Messaging Engines → <messaging
engine> → <mediation_name> → Destinations.
6. Click the queue destination. See Figure 11-12.
7. Check the boxes to the left of the counters and click Enable.
Figure 11-12 Enable the mediation counters
8. Click Thread Usage under Destinations.
9. Check the box to the left of ThreadCount and click Enable.
To view the counters, perform the following steps:
1. Select Monitoring and Tuning → Performance Viewer → Current activity.
2. Click the server name.
3. Expand Performance Modules → SIB Service → SIB MessagingS
Engines → <message_engine> → <mediation_name>.
See Figure 11-13 on page 386.
Get Patterns: Implementing Self-Service in an SOA Environment now with the O’Reilly learning platform.
O’Reilly members experience books, live events, courses curated by job role, and more from O’Reilly and nearly 200 top publishers.

