Chapter 9. JSF front-end scenario 283
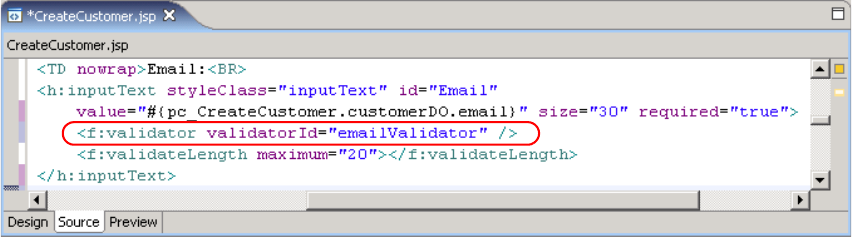
Figure 9-28 Using custom e-mail validator
Once the validator is associated with inputText, the validation behaves as the
standard one would. You can associate a Display Error
JSF component adjacent
to the email field, and validation errors would be displayed in the same way
standard errors were. In fact, looking back at Figure 9-9 on page 261, you can
see that the standard validation error for last name has the same general
appearance as the custom one we applied on the e-mail address.
9.4.7 Debugging applications in Rational Software Architect
Rational Software Architect provides a comprehensive debugging facility, which
also supports JSF. Although a complete discussion of the debugging features
would be out of the scope of this chapter, we do provide an introduction of how to
perform a simple debugging task on a JSF application.
Using our customer creation example, we imagine a situation where the
customer profile was not entered correctly in the database. In this scenario, we
suspect the values entered by the user in the screen are being corrupted
somewhere before they are inserted in the database. To debug this problem, we
might want to see the values collected from the UI components, just before they
are passed in to the session facade. The following subsections present the
different steps we would take to perform that debugging task.
Starting the server in debug mode
Before we can perform debugging on the application server, we need to start it in
debugging mode. To following steps describe that process:
1. In the workspace, open the Servers view, which is generally available as a
one of the tabs in the bottom center area.
1. Right-click the server you are using. In our example, we used the WebSphere
Application Server V6 test environment that comes integrated with Rational
Software Architect.
284 Patterns: Implementing Self-Service in an SOA Environment
2. In the context menu select Debug. Alternatively, a short cut icon with the
usual bug picture is also available on the top right side of the Servers view.
The WebSphere server starts in debug mode. Note that if the server was already
running in normal mode, it would have to be restarted to operate in debug mode.
Setting breakpoints
The next step is to set a breakpoint to stop the code execution at the right spot.
In our case, we want to stop inside the doCreateCustomerAction
method of the
CreateCustomer
managed bean, just before we call the createCustomer method
in the session facade
. This is accomplished with the following steps:
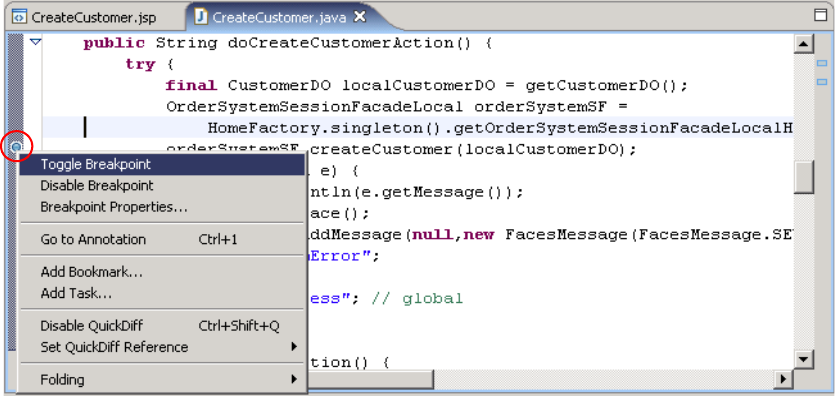
1. Open the CreateCustomer.java file in the standard Java editor window.
2. Right-click the marker bar (vertical ruler) to the left of the line at which we
want to stop the execution flow. This should bring up a context menu, as seen
in Figure 9-29.
Figure 9-29 Setting a breakpoint
3. In the context menu select Toggle Breakpoint.
The breakpoint is set. A small blue circle on the marker bar, indicates the
breakpoint location.
Debug the application on a server
To begin the debugging session, start the application in debug mode on the
server. We start at the home page CustomerAdmin.jsp as follows:
Chapter 9. JSF front-end scenario 285
1. Right-click the CustomerAdmin.jsp in the Project Explorer view.
2. In the context menu select Debug → Debug on Server ...
3. The application opens on the standard Internet browser. Follow the customer
creation use case, entering information about the user on the
CreateCustomer.jsp page, and then clicking the Create button.
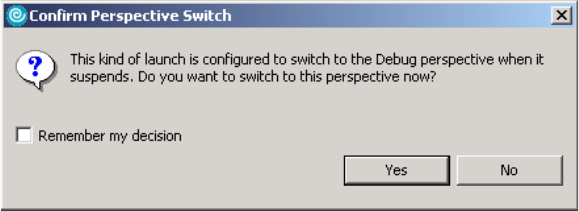
4. When the code reaches the breakpoint we set, it will stop execution, and
prompt the user to switch to the debug perspective, as seen in Figure 9-30.
Figure 9-30 Confirm switch to debug perspective
5. Click Yes, and the workspace changes to the Debug perspective, which we
discuss on the next section.
Debug perspective
Figure 9-31 on page 286 provides a bird’s eye view of the debug perspective in
Rational Software Architect. The default view shows the following panels:
The Debug view at top left highlights the stack trace for the thread we are
currently debugging.
The Variable view at top right displays different application and system
variables.
The middle area shows the code where the execution was suspended, and
the outline for the class. The exact line where the code stopped, is
highlighted. In our case, this is the line on the CreateCustomer.java managed
bean where we are calling the createCustomer method in the session facade
.
The Console view at the bottom shows the standard WebSphere console
error messages.
Get Patterns: Implementing Self-Service in an SOA Environment now with the O’Reilly learning platform.
O’Reilly members experience books, live events, courses curated by job role, and more from O’Reilly and nearly 200 top publishers.

