Head and Shoulders
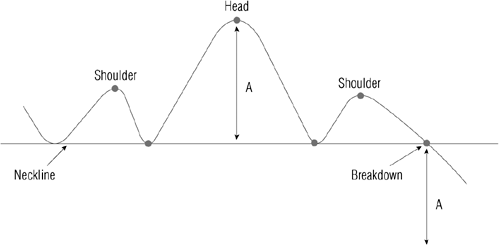
Diagram 4.3.1. Head and Shoulders.

A Head and Shoulders pattern occurs when a peak (Head) is sandwiched between two lower peaks (Shoulders). In logical terms, the chart is telling us that the (stock) price did not have the strength to rise through either preceding highs. This is interpreted as weakness, and imminent decline in the price is likely by at least the amount of distance (A) between the neckline and the middle (Head) high.
| Head and Shoulders Summary | |
|---|---|
| What the pattern means. | Possible weakness in the stock if it breaks the support line (neckline). |
| What to do. |
|
Get Options Made Easy: Your Guide to Profitable Trading, Second Edition now with the O’Reilly learning platform.
O’Reilly members experience books, live events, courses curated by job role, and more from O’Reilly and nearly 200 top publishers.

