Chapter 4. Targeting the Right Improvement Activity
When you have collected properly scoped diagnostic data for some targeted user actions, it’s time to figure out how to repair the problem:
Execute the candidate optimization activity that will have the greatest net payoff to the business. If even the best net-payoff activity produces insufficient net payoff, then suspend your performance improvement activities until something changes.
Performing this task well requires thinking in two distinctly different fields. First, there’s the job that everyone knows about: the technical job of figuring out which changes might cause performance improvement. The analysis that you might not have expected is the job of predicting the financial impact of each change. This is the job that many performance analysts don’t do very well (most analysts don’t do it very well because they don’t try to do it at all). It is the job that is almost impossible to perform with conventional “Oracle tuning” methods. But by not predicting the financial impact of a change before you make it, you lose the ability to make well-informed performance improvement decisions that suit the priorities of your business.
A New Standard of Customer Care
In many ways, Oracle performance analysis is still in its infancy. The age of response time-based optimization methods—ushered in by the likes of Juan Loaiza, Roderick Mañalac, Anjo Kolk, and Shari Yamaguchi—is certainly a big technical leap forward. But technical advances represent only a part of our field’s necessary growth path. The standard of quality with which we treat our customers (our users, our managers, our consulting clients...) is another tremendous growth opportunity for us.
The Stanford University Human Subjects Manual illustrates how I believe we ought to treat our customers. The following text is an excerpt from the chapter entitled “Informed Consent” [Stanford (2001)]:
The voluntary consent of the human subject is absolutely essential. This means that the person involved should:
Have the legal capacity to give consent;
Be so situated as to be able to exercise free power of choice, without the intervention of any element of force, fraud, deceit, duress, over-reaching, or other form of constraint or coercion; and
Have sufficient knowledge and comprehension of the subject matter and the elements involved as to enable him or her to make an informed and enlightened decision.
This latter element requires that all of the following be made known to the subject:
The nature of the experiment;
The duration of the experiment;
The purpose of the experiment;
The method and means by which the experiment is to be conducted;
All inconveniences and hazards reasonably to be expected;
The effects upon the subject’s health or person which may possibly come from his or her participation in the experiment.
I find the idea of informed consent extremely relevant to our profession. Thankfully, few Oracle analysts live under the kinds of literally life-and-death pressures that medical practitioners deal with every day. But, regularly, many of us are enlisted to execute very technical tasks that few non-specialists understand, in situations that involve very high stakes for the customers who need our help. The doctrine of informed consent is a sort of “bill of rights” that protects any customer who lives on the short end of the teeter-totter in a technology balance of power.
But living up to the standard of informed consent is virtually impossible for practitioners who use the conventional Method C Oracle tuning approach. The Method C technology simply doesn’t provide you with the information you need to predict how a project—or even a small piece of a project—is going to turn out. You can’t tell your customers something you don’t know. One of the most important benefits of Method R is that it puts within reach the technical tools that enable us to enact this informed consent standard of customer care within our profession.
How to Find the Economically Optimal Performance Improvement Activity
By now, you’ve probably noticed that a central theme of Method R is careful targeting. How you respond to your diagnostic data fits the theme. Your response consists of three targeting steps:
First, the analyst targets the user actions for which performance improvement provides the best potential economic value to the business (Chapter 2).
Next, the analyst targets the correct time scope and action scope for diagnostic data collection (Chapter 3).
Finally, the analyst targets for implementation the performance improvement activity with the best expected net payoff (Chapter 4).
As I described in Chapter 1, the data format that best facilitates this third act of targeting is the resource profile. However, a resource profile is only part of the information that you’ll need. After you learn from your resource profile where a user action’s time went, your next step is to mine the diagnostic data to determine why a targeted component of response time took so long. Fortunately, if you have collected well-scoped extended SQL trace data, then everything you’ll need is already in your possession. If you have not collected well-scoped extended SQL trace data, then you probably shouldn’t have escaped the bounds of Chapter 3 just yet.
Once you have collected properly time- and action-scoped diagnostic data for each of your few (one to five) targeted user actions, the following algorithm combines the technical and financial analysis elements required to reveal the optimal action for your business:
For each targeted user action:
Assemble your diagnostic data into a format that helps you attribute root causes to elements of the action’s response time consumption.
Estimate the net payoff of the best few options for performance improvement. Add the option and its expected net payoff to the list of candidate performance improvement activities.
From the list of candidate performance improvement activities, determine which activities will provide the best net payoff for the business.
When you’ve performed these steps, you’ve identified the performance activities that will most benefit your business. The next thing you’ll do is set this book down and go convert your performance improvement plan into reality.
Tip
Method R is a significant departure from conventional “tuning” approaches. Method R is not about chasing down a list of ratios or even wait events that look suspicious. It’s about aligning the priorities of performance improvement with business need. Your business drives prioritization decisions in an optimized performance improvement project, not your technology.
Making Sense of Your Diagnostic Data
Part II contains all the information you will need to respond to properly scoped performance diagnostic data. As you’ll see, the Method R pathway through your diagnostic data is deterministic. Therefore, assembly of raw Oracle trace data into something you can analyze conveniently is a task that can be automated. Some form of automation is essential if your job includes analyzing several megabytes of raw trace data. At the time of this writing, I am aware of three tools that Oracle Corporation provides to help:
- tkprof
tkprof is a trace file formatter that takes raw Oracle trace data as input and emits a text file that shows performance statistics aggregated by SQL statement. Different command-line options allow you to select the order in which the SQL statements are shown. tkprof was designed for unit-level performance testing of SQL applications, and it does an excellent job in that role. Oracle9i is the first release in which tkprof processes the Oracle “wait event” data required by Method R. Prior versions of tkprof simply ignore the wait data. (Chapter 5 explains the significance of Oracle “wait events.”) For more information about tkprof, see the Oracle Performance Tuning Guide and Reference (http://technet.oracle.com) and MetaLink documents 41634.1, 29012.1, and 1012416.6.
- trcsummary
trcsummary is a tool that Oracle Corporation advertises as “not available for general customer use.” It uses awk and nawk to parse an Oracle trace file and provide similar output to that produced by tkprof. It was apparently designed to overcome some of the deficiencies of early tkprof releases. For more information about trcsummary, see Oracle MetaLink document 62160.1.
- Trace Analyzer
Trace Analyzer is a set of SQL*Plus scripts and PL/SQL code that reads a raw SQL trace file, loads its content into a database, and then prints a detailed report. Trace Analyzer is capable of processing Oracle “wait event” data. For more information about Trace Analyzer, see Oracle MetaLink document 224270.1.
Of these three options, Oracle’s Trace Analyzer is the newest and most comprehensive, but it is also the most cumbersome to use. It is very slow, and the prodigious quantity of un-prioritized output that it emits can require days of analysis to decipher.
The trace file analyzer I use is a commercial product in which I meddled while Jeff Holt did all the real work, called the Hotsos Profiler TM. We built the Hotsos Profiler because no other tool on the market took us from data collected to problem solved as fast as we needed. The Hotsos Profiler takes just a few seconds to convert a multi-megabyte extended SQL trace file into an HTML document that reveals the root cause of virtually any performance problem within two mouse clicks. With Hotsos Profiler output, I expect to understand the net payoffs of all my best performance improvement options within one hour of acquiring a properly scoped trace file. You can read about the Hotsos Profiler at http://www.hotsos.com.
Once you have assembled your diagnostic data into a format that you can analyze, your next job is to determine how you might go about improving the performance of your targeted user action. Your work at this point becomes a brief iterative process that looks something like this:
Use the resource profile to identify the components of response time that appears to offer the best net payoff opportunity. Then find the diagnostic data elements that will illustrate why the components account for so much response time.
Assess ideas that you believe will best reduce time spent in the response time component targeted in step 1. To do this, you’ll typically test a performance improvement idea on a testing system. The result of such a test provides the data you need to forecast the net payoff of a project to implement an idea. Assess enough ideas to convince yourself that you’re not overlooking any high-payoff performance improvement opportunities.
I defer the technical details of how to execute these steps to Part III. The remainder of this chapter is devoted to the task of forecasting the net payoff of a project.
Forecasting Project Net Payoff
The point of a performance improvement project is economic optimization. When you undertake a performance improvement project, you’re implementing a willingness to make a time and materials investment in exchange for an improved amount of economic value coming out of the system. Optimizing successfully requires that each of your work steps be an informed action. That is, you should know the costs and benefits of every step you take before you take it.
The rule that should guide your behavior is simple: before making any investment, you should understand the expected net payoff of that investment. The net payoff of a project is the present value (PV) of the project’s benefits minus the present value of the project’s costs. The concept of present value is conceptually simple:
A dollar today is worth more than a dollar tomorrow, because the dollar today can be invested to start earning interest immediately. [Brealey and Myers (1988), 12]
The PV formula is the tool you need to “normalize” future cash flows into present-day dollars so that you can make an apples-to-apples comparison of investments and payoffs that are expected to occur at different times in the future. To forecast the net payoff of a proposed project, then, you’ll need to execute the following steps:
Forecast the business benefits of the proposed activity and the timings of those benefits.
Forecast the business costs of the proposed activity and the timings of those costs.
Compute the PV of each cash flow component by using the formula:
where C is the future cash flow, and r is the rate of return that you demand for accepting delayed payment. Microsoft Excel provides a built-in PV function to perform this calculation.
For example, if you expect a rate of return of r = 0.07 (this is the approximate average rate of return of the U.S. stock market over the past 90 years), then the present value of a dollar received one year from now is only about $0.934579. In other words, if you expect a 7% rate of return, receiving $1 in one year is of equivalent value to receiving $0.934579 today. The reason is that you can invest $0.934579 today, and if you receive 7% interest on that money, in one year it will be worth $1.
Compute the net payoff of the proposed activity by summing all the benefit PVs and subtracting all the cost PVs.
Once you know the PV of each proposed activity, you (or your project’s decision-maker) can make simple comparisons of proposed activities based on their estimated financial values.
Forecasting Project Benefits
The resource profile vastly simplifies the task of forecasting the business benefit of a proposed performance improvement activity. I remember painfully the days before Method R, when the only ways we had to forecast business benefits were to extrapolate well beyond our mathematical rights to do so. For example, I can remember when professional analysts used to forecast results like this:
“I have reduced the number of extents in your sales order table from 3,482 to just 8. It is expected that this improvement will increase across-the-board Order Entry performance by 30 percent.”
“Increasing the buffer hit ratio from 95 to 99 percent can yield performance gains of over 400 percent.”
I have books that say stuff like this. Did you ever wonder where a number like “30” or “400” comes from in statements like these? Unless such a number comes from a properly scoped resource profile, then you can virtually be assured that it came from a place where unsubstantiated estimates hide when they’re not being drafted into service by a consultant whose earnings capacity relies upon an ability to inspire customer hope.
Tip
I always derive a kind of sinister enjoyment when I see benefit statements written with phrases like, “It is expected that....” The use of passive voice in situations like this is a grammatical tool that authors use when they want to make it possible later to disassociate themselves from their own guesses.
I hope this book will help you both make better performance improvement decisions and insist upon better decisions from the professionals who are supposed to be helping you.
Monetizing the benefits
There are two steps in forecasting the benefits of a proposed performance improvement action:
Estimate the amount of response time you can eliminate from a targeted user action. Part III describes how to do this.
Estimate the cash value to the business of that response time improvement. Arithmetically, this calculation is straightforward. It is the product of the following three quantities:
The number of seconds you can remove from a user action multiplied by The number of times the user action will be executed over the period during which the business benefits are being forecast multiplied by The cash value of one second of response time to the business
Step 1 is simple in practice. As you’ll learn in Part III, a resource profile generated on a production system provides all the before timing statistics you need, and a resource profile generated on a test system helps you forecast your after timing statistics. Step 2 is usually simple as well, until it comes time to estimate the cash value of one second of response time to the business. Many businesses simply don’t know this number. Some businesses do. For example, your company may already know information like the following:
Improving the speed of the return materials authorization process from 5 days to 2 hours will be necessary to prevent losing our largest retail customer. An annual sales impact of over $100,000,000 hangs in the balance.
Reducing the time it takes to invoice our customers from 4 days to 1 day will reduce our working capital requirement by
325.000.
Improving the performance of the form through which our users pay invoices will improve accounting staff morale, reduce staff turnover, and reduce overtime wages, resulting in annual cost savings of over £60.000.
Increasing the number of orders processed on the system from the current state of 40 orders in a peak hour to 100 orders per hour will increase annual sales revenue by over ¥100,000,000.
For businesses that don’t have such concrete “dollar"-per-second value specifications, it is usually good enough to express project value in terms of un-monetized response time savings over some reasonable period. A resulting net payoff statement might look like this:
I expect Project A to be complete within two weeks at a cost of $10,000. I expect as a result, we will reduce end-user response times by over 128 hours per week.
With the “dollar"-per-second value specification in hand, though, the net payoff statement makes decision-making a little easier:
I expect Project A to be complete within two weeks at a cost of $10,000. I expect as a result, we will reduce end-user response times by over 128 hours per week, which will save the company over $70,000 in labor expenses per year.
Monetizing the expected benefits of a project is often an unnecessary academic exercise. This is especially likely in projects in which the cost of the appropriate remedy action is low compared to the obvious business value of the repair. For example, the following requirements range widely from very vague to very specific. However, each provides a perfectly legitimate level of detail in its place:
I don’t know how long this report should run. I just know that how long it’s running now can’t be right. We’ll appreciate anything you can do to help.
We can’t live with the application unless you can reduce the response time for this transaction from several minutes down to only a couple of seconds.
This transaction must respond in 1.0 seconds or less in 95% of executions.
This transaction must consume less than 13 milliseconds on an unloaded system.
I explain in Chapter 9 how and why you might formulate extremely detailed requirements like the final two shown here with only the limited information available from an application unit test. In such detailed specifications, it will usually be important for your project sponsor to assign a business value to the requirement. I’ve witnessed several projects that survived only because during the course of the project, the project sponsor relaxed several of his original specifications when he found out how much it was going to cost to actually meet them.
If you can’t monetize the benefits
It’s often not a problem if you can’t reasonably approximate the “dollar"-per-second value of response time reductions. If the remedy you propose is inexpensive to obtain, then your project sponsor will probably never require a cash benefit justification. In this case, the only person who will really miss the data is you—you’ll miss the opportunity to quantify the financial impact of your good work. If the remedy you propose is very expensive, then an inability to affix a reasonable value to your expected response time savings will result in one of three outcomes:
Your project sponsor will estimate the financial benefit and make a well-informed financial decision about your project direction.
The project will be allowed to continue in spite of the lack of objective financial justification, which may or may not be a mistake—you won’t know until the project is done.
The project will simply be called off on the grounds that “it will cost too much.” The best way I know to combat a project termination threat is to prove the financial benefit of the project net payoff. If the project can’t stand up to the scrutiny of financial justification, then termination is almost certainly the right answer.
The financial benefit estimation task is in place solely to provide the data that you or your project sponsor will need to make financial decisions about your project. It’s nothing more than that. Don’t diminish your credibility by letting unnecessarily detailed forecasting of business value bog down your project.
Forecasting Project Cost
Forecasting a project’s net payoff requires both a forecast of benefits and a forecast of costs. Forecasting costs is the easier of the two tasks, because there’s so much more infrastructure in place to help you do it. Lots of people are good at estimating the level of investment required to try something. Consultants, for example, take courses in proposal development that fine-tune their skills in estimating project costs. Consultants who can’t estimate project costs with reasonable accuracy go out of business (and typically then go to work for other consultants who can).
For you to produce reasonable project cost forecasts, you of course must understand the tasks that will be required to implement a proposed performance improvement. I have provided a lot of information in Part III that I hope will stimulate you to better understand many of those tasks and materials.
Forecasting Project Risk
Even the best projects usually miss their forecasts. It is virtually impossible to predict the precise benefit or cost of any complicated activity. Therefore, the best forecasters integrate the concept of risk into their assessments. Before a project has completed, its cost and benefit are random variables. A random variable is a concept that mathematicians use to describe the result of a process that cannot be predicted exactly, but that is constrained in some understandable way. Each variable has an expected value, but each has properties of variance that you need to understand going into the project. Financial analysts use the word “risk” to refer to what statisticians measure as “variation” [Kachigan (1986); Bodie, et al. (1989)].
It is possible to measure the risk of a project that has occurred in the past, if you have data from enough projects to draw statistically valid conclusions. To consider how it is possible to measure project risk, imagine that thirty different project teams were to embark upon thirty identical performance improvement projects. It is virtually inconceivable that all thirty projects would come in at the exact same cost and deliver the exact same benefit. If we could perform such an experiment in real life, then with so many project teams participating, we would actually have enough data at the conclusion of our experiment to determine a statistical pattern in the costs and benefits. If you were to plot a histogram of, for example, project costs across all thirty executions of the project, you might end up with the one shown in Figure 4-1.
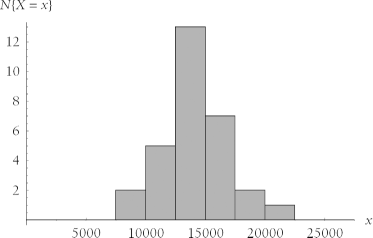
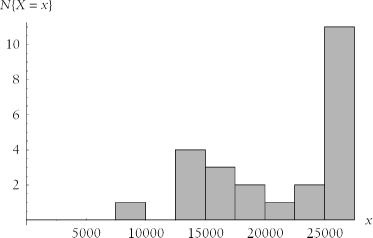
The costs depicted in Figure 4-1 exhibit a clear tendency to cluster around the value 15,000 (imagine that this figure represents units of your local currency). If the cost numbers happened to be skewed rightward and distributed over a wider range, like the ones shown in Figure 4-2, then, quite simply, the project’s risk is greater: there’s a greater chance that the project will overrun its cost estimate.
If you had the luxury of having project cost and benefit data from large numbers of projects that are exactly like the one you’re undertaking, then of course you’d be a lot better able to predict the true cost and benefit of your project. But you probably don’t have this kind of data unless you’re a company that does the same type of project over and over again. (Companies who execute the same type of project over and over again can get quite good at predicting project costs and benefits.)
Several factors influence the risk of cost overruns and benefit shortfalls in a project. The dominant factor is experience. Doing something that nobody has ever done before is understandably risk-intensive. But even executing a simple project with a team that has never done it before can produce unpredictable results. Experience isn’t the only thing, though. One of my favorite lessons from athletics is this one [Pelz (2000)]:
Practice makes permanent. Only perfect practice makes perfect.
This is a scientist’s way of saying that just because someone has done something ten thousand times doesn’t mean he does it well.[1] A consistent track record of success in similar projects is a tremendous risk reduction factor.
You can get as fancy at forecasting variances as you want. However, don’t lose sight of the goal of your adventures in risk forecasting. What you’re really looking for is the ability to predict two things that your customer needs to know, and that can come directly from the “informed consent” text cited earlier in this chapter:
All inconveniences and hazards reasonably to be expected
The effects upon the subject’s health or person which may possibly come from his or her participation in the experiment
You’ll never be able to predict the exact costs and benefits of every project action you recommend. But, by using the techniques described in this book, you will be able to refine your predictive abilities very rapidly.
[1] A related observation is this: meeting a given quality standard ensures only consistent quality, not necessarily high quality.
Get Optimizing Oracle Performance now with the O’Reilly learning platform.
O’Reilly members experience books, live events, courses curated by job role, and more from O’Reilly and nearly 200 top publishers.

