Formula Review
- Mean:

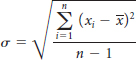
- Standard deviation:
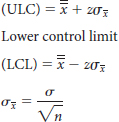
- Control limits for x-bar charts: Upper control limit
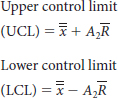
- Control limits for x-bar charts using sample range as an estimate of variability:
- Control limits for R-charts:

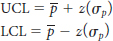
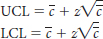
- Control limits for p-charts:
- Control limits for c-charts:
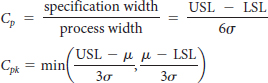
- Measures for process capability:
- Average outgoing quality: AOQ = (Pac)p
Get Operations Management: An Integrated Approach, 5th Edition now with the O’Reilly learning platform.
O’Reilly members experience books, live events, courses curated by job role, and more from O’Reilly and nearly 200 top publishers.

