STATISTICAL PROCESS CONTROL METHODS
Statistical process control methods employ descriptive statistics to monitor the quality of the product and process. As we have learned so far, there are common and assignable causes of variation in the production of every product. Using statistical process control, we want to determine the amount of variation that is common or normal. Then we monitor the production process to make sure production stays within this normal range. That is, we want to make sure the process is in a state of control. The most commonly used tool for monitoring the production process is a control chart. Different types of control charts are used to monitor different aspects of the production process. In this section we will learn how to develop and use control charts.
FIGURE 6-1 Normal distributions with varying standard deviations
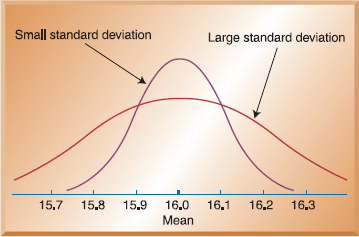
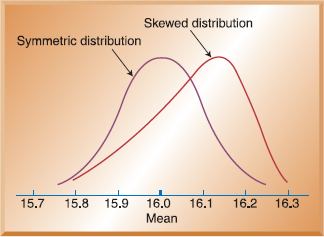
FIGURE 6-2 Differences between symmetric and skewed distributions
![]() Control chart
Control chart
A graph that shows whether a sample of data falls within the common or normal range of variation.
![]() Out of control
Out of control
The situation in which a plot of data falls outside ...
Get Operations Management: An Integrated Approach, 5th Edition now with the O’Reilly learning platform.
O’Reilly members experience books, live events, courses curated by job role, and more from O’Reilly and nearly 200 top publishers.

