APPENDIX B
The Standard Normal Distribution
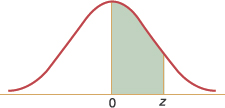
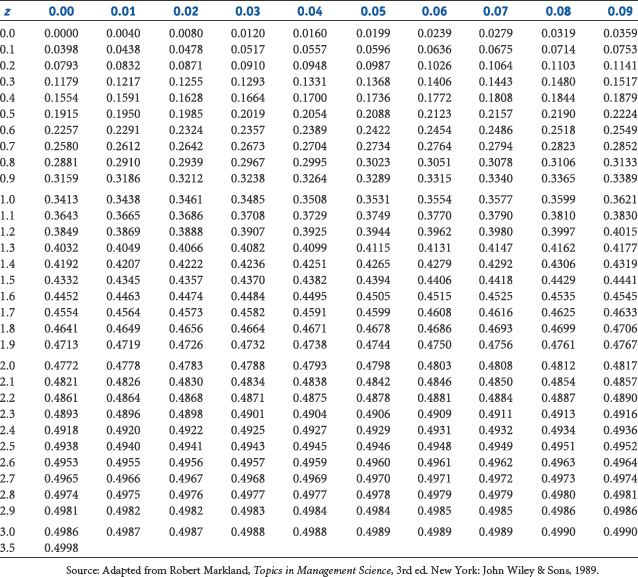
This table gives the area under the standardized normal curve from 0 to z, as shown by the shaded portion of the following figure.
Examples: If z is the standard normal random variable, then
Prob (0 ≤ z ≤ 1.32) = 0.4066
Prob (z ≥ 1.32) = 0.5000 – 0.4066 = 0.0934
Prob (z ≤ 1.32) = Prob (z ≤ 0) + Prob (0 ≤ z ≤ 1.32)
= 0.5000 + 0.4066 = 0.9066
Prob (z ≤ 21.32) = Prob (z ≥ 1.32) = 0.0934 (by symmetry)
Get Operations Management: An Integrated Approach, 5th Edition now with the O’Reilly learning platform.
O’Reilly members experience books, live events, courses curated by job role, and more from O’Reilly and nearly 200 top publishers.

