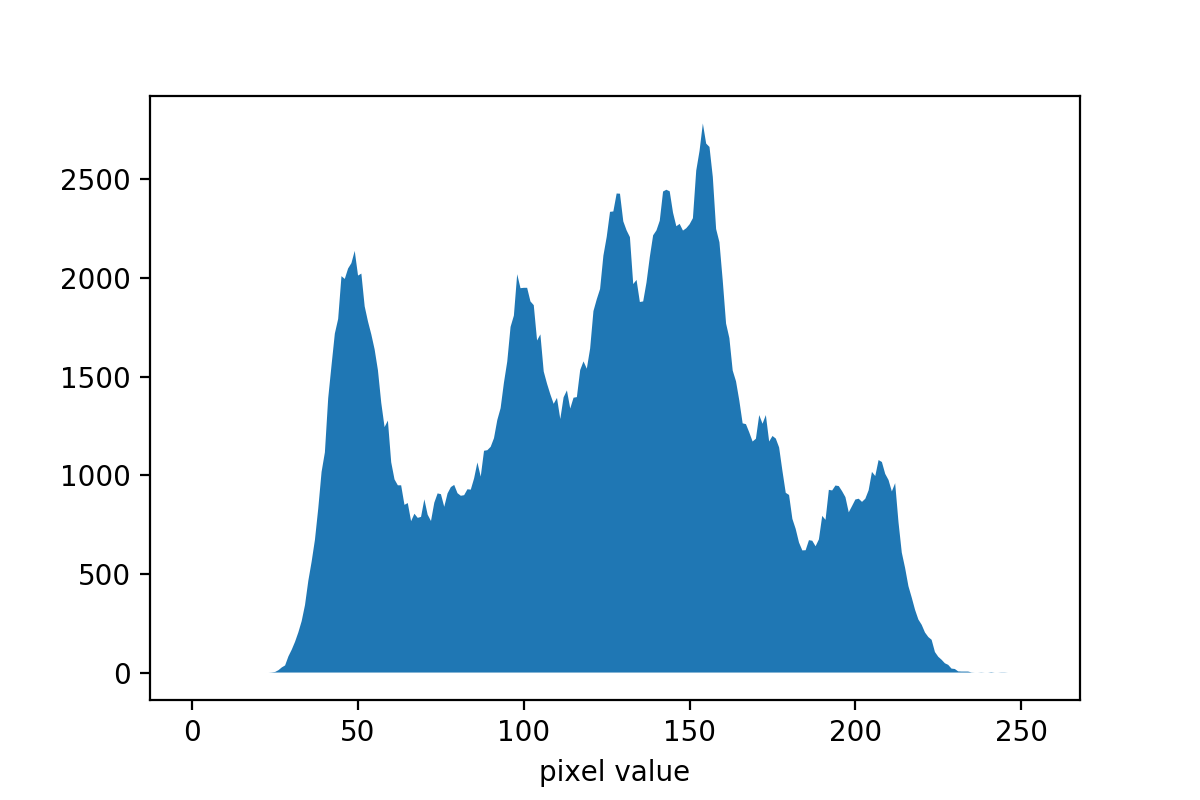
OpenCV has its own generic function for computing histograms, cv2.calcHist. However, in this recipe, we will use NumPy since, in this particular case, it makes code more concise. NumPy has a special function to compute histograms, np.histogram. Arguments of the routine are the input image, number of bins, and range of bins. It returns an array with histogram values and edge values for bins.
To plot the histogram as a figure, we need to use functionality from the matplotlib module. The output figure should appear as follows: