Light the Way with Candlestick Charts
Price patterns are easier to spot when you graph price movement with candlestick charts.
Japanese rice growers and merchants used candlestick charts to track and trade rice contracts as far back as the 1600s. The Japanese financial markets adopted and refined them, and then imported them to the U.S. as they have many other products. Candlestick charts have become the default representation for many Internet charting sites. Although candlesticks show the same data found in bar charts, albeit in a different way, candlesticks convey price action with no more than a quick glance. Using candlesticks effectively takes time and study. However, the rewards can be significant; candlestick charts can show trends, flag potential price reversals, and confirm buy and sell signs.
A candlestick bar earned its name because it looks like a candle, complete with a wick at the top and bottom, which are also called shadows. Candlestick bars show the opening, closing, period high, and period low prices in a way that accentuates price action. When a tradable investment closes higher for the day, the candlestick is open or white, as illustrated in Figure 5-3. Conversely, closed or black candlesticks represent a drop in price for the day.
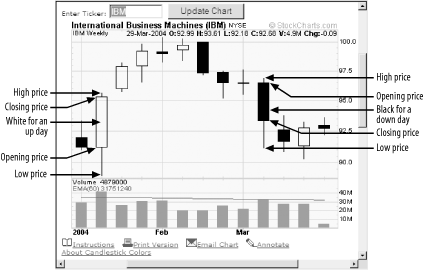
Figure 5-3. Candlesticks make price action more apparent (from StockCharts.com)
As shown in Figure 5-3, the top of an up candle body ...
Get Online Investing Hacks now with the O’Reilly learning platform.
O’Reilly members experience books, live events, courses curated by job role, and more from O’Reilly and nearly 200 top publishers.

