If you don’t want to coerce too many brain cells into building an analysis spreadsheet, you can find a few Excel tools for free.
Spreadsheets are great tools for analyzing stocks, but building your own [Hack #45] takes some time—particularly when you’re still trying to learn what financial measures mean and how financial ratios reflect performance. The Web offers plenty of free tools as the results from any online search will indicate, but finding tools that are worth something is another matter entirely. However, you can count on someone who volunteers his time teaching investing to offer an outstanding, free web site with both tools and education.
Bob Adams, a director on the national NAIC Computer Group Advisory Board as well as the Puget Sound chapter, has a web site (http://bobadams.homestead.com/bobsite.html) that offers several spreadsheets for analyzing the fundamental measures of companies, not to mention other spreadsheets for portfolio management [Hack #76] . What makes these analysis tools the best is that they include comments that explain what measures and ratios represent, and identify desirable values or red flags for each. The web site is intended to provide access to files for people who attend Mr. Adams’s investment classes. However, anyone who wants to learn how to analyze stocks can download any of the files. Here are some of the analysis tools you can use:
- MS Excel Spreadsheet
Click the Excel button in the Analyzing the Annual Report section of the web page to download an Excel spreadsheet suitable for analyzing manufacturing companies. The spreadsheet contains macros for downloading most of the data you need from NAIC Online Premium Services data files [Hack #20] . However, for a completely free analysis, you can enter values manually.
- Annual Report Instructions
If the small books that companies publish and call their annual reports seem daunting, learn what’s important and how to interpret it by clicking the Instructions button in the Analyzing the Annual Report section of the web page.
- Enron Analysis
For another view of spotting Enron troubles [Hack #39] before they hit the news wires, click the Enron button.
- Analyze Bank Stocks
Click the Bank Analysis button to download an Excel spreadsheet suitable for analyzing banks as investments [Hack #44] .
Tip
Because bank analysis uses some data that you won’t find for other types of companies, click the Bank Data button to download an Adobe Acrobat .pdf file guide to bank financial statements.
Whether you use the analysis spreadsheet for manufacturing companies or banks, the financial ratios you want to evaluate appear on the left, as shown in Figure 4-43 [Hack #44] , [Hack #8] .
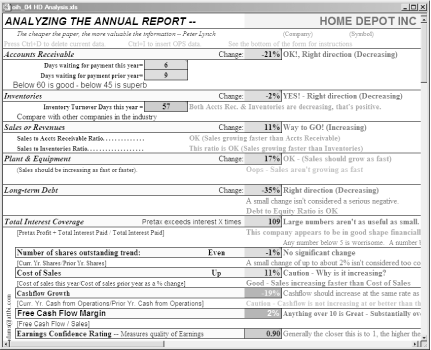
Additional hints appear to the right of most ratio cells indicating
whether the value in the cell is good or bad. These hints use Excel
IF functions
[Hack #12]
along with formulas to
display different hints depending on the value in the cell. Home
Depot’s inventories change is -2 percent. The hint
indicates that decreasing inventories are what you want to see.
For some measures, you must evaluate a result in comparison to another result and this spreadsheet includes hints for that as well. For example, Home Depot’s cost of sales has increased 11 percent. The spreadsheet hint asks why the value is increasing. However, another hint informs you that sales are increasing faster than the cost of sales. If a retail company such as Home Depot increases its sales that means it’s selling more products, which in turn means it must pay more for the inventory it puts on its shelves.
The spreadsheet for analyzing bank stocks includes cells at the bottom of the data column for types of loans and the percentage they represent in the bank’s loan portfolio. Each type of loan carries a different level of risk, and the spreadsheet uses these values to calculate a loan risk ratio.
Tip
When you click cells other than those for data in the spreadsheet, you’ll notice that the data cells are the only ones you can edit. The rest of the spreadsheet cells are protected, so you can’t inadvertently edit their formulas. However, if you want to examine the formulas in the spreadsheet cells, choose Tools→Options, select the View tab and check the Formulas checkbox under the Windows options heading.
These Excel spreadsheets contain macros that import data from an NAIC .ssg data file [Hack #20] , which you can download when you subscribe to NAIC’s Online Premium Services. However, you can also enter data from annual reports manually. In fact, a few data items aren’t available from Online Premium Services. When you see three question marks (???) in a cell, you must find that value in the financial statements in a company’s annual report or 10 K filing.
JaxWorks (http://www.jaxworks.com/download.htm), the “Small Business Spreadsheet Factory,” has a free spreadsheet that compares a company with the average values for its industry. Click the Financial Comparison Analysis link to download it.
You can download a spreadsheet that performs a technamental stock analysis, as defined by Ellis Traub, at Yahoo! Finance (http://finance.groups.yahoo.com/group/TSSW_Excel).
Get Online Investing Hacks now with the O’Reilly learning platform.
O’Reilly members experience books, live events, courses curated by job role, and more from O’Reilly and nearly 200 top publishers.

