Calculate and evaluate a company’s profitability to determine its chances of future success.
One of the cornerstones of successful long-term investing is identifying stocks whose profits are growing steadily. The idea behind this approach is that a company that consistently grows its earnings will eventually see its share price grow as well. Although companies can increase their earnings by selling more goods or services, they also must be mindful of how much of each dollar of sales represents profits on their books if they want to make as much money as possible (which is any company’s goal, after all). There are several ways to assess a company’s profitability, and each way reveals how well the company is run and whether the company is well-positioned for the future.
Like canaries in a coal mine, profit margins serve as an early warning device. If profit margins begin to fall, earnings might begin to decrease, which often leads to drops in stock price. By watching for downward trends in profit margins, you can sell a company before its slipping performance hurts your portfolio. The key profitability ratios to examine are gross margin, operating profit margin, net profit margin, and pre-tax profit margin.
Start your analysis of a company’s profitability by examining its gross margin. This figure reveals how inexpensively a company can manufacture or acquire the goods it sells to customers. To calculate a company’s gross margin, you first need to identify its gross profit, which is the amount that a company makes from its core business after paying the cost of goods sold (the cost of raw materials and manufacturing), but before accounting for salaries, marketing, interest, and taxes. For a retail company, cost of goods sold is the amount it pays to suppliers for the products that stock its shelves. Using a company’s income statement, you can calculate gross profit from these variables, as shown in Example 4-43.
Example 4-43. Formulas for gross profit and gross margin
Gross Profit = Total Revenue - Cost of Goods Sold (COGS)
% Gross Margin = (Gross Profit / Total Revenue) * 100
A company’s gross margin gives you a good idea of the underlying profitability of a company’s primary operations. Businesses strive to keep their gross margin as high as possible by keeping their raw material and manufacturing costs low, because a company with lower product costs has better control over the prices that it can charge its customers. Besides contributing to its overall profits, this higher level of efficiency can help the company combat pressure from competitors or weather tough times.
It’s not enough for a company to have low gross margins, however. No matter how inexpensively they can make goods or acquire inventory for their shelves, they must also manage the expenses related to selling those products. The operating profit margin evaluates these costs and their impact on the company’s overall profitability.
You calculate a company’s operating profit (or operating income) by adding to the cost of goods sold the rest of the expenses involved directly in the business, and subtracting the result from revenues. These other expenses are known as selling, general, and administrative expenses (SG&A), and include the costs of administration, salaries, advertising, and marketing. Operating income is also known as earnings before interest, taxes, depreciation, and amortization (EBITDA) [Hack #29] .
Calculate the operating profit margin by using the operating income from a company’s income statement, as in Example 4-44.
Example 4-44. Formula for the operating profit margin
% Operating Profit Margin = (Operating Profit / Total Revenue) * 100
The operating profit margin goes beyond the question of whether the company can manufacture goods inexpensively to examine whether a company spends money wisely on the rest of its overhead expenses. If a company’s SG&A expenses exceed the amount it can charge for those goods or if rising expenses reduce its operating profit margin below that of competitors, low manufacturing costs are ineffective. This is why companies sometimes move to protect their operating profit margin by downsizing—laying off staff, closing facilities, or eliminating less profitable product lines.
Nothing is certain but death and taxes, as the old saying goes, but a company’s management often doesn’t have a lot of control over the taxes the company pays. Tax rates can change, and complicated tax credit schemes can affect the taxes a company must pay. To remove variations in profit margins due to these circumstances that management can’t control, investors often put the most emphasis on a company’s pre-tax profit margin.
Calculate the pre-tax profit margin using the formula in Example 4-45 and data from the income statement.
Example 4-45. Formula for pre-tax profit margin
% Pre-Tax Profit Margin = (Net Income Before Tax / Total Revenue) * 100
Tip
For many companies, net income before taxes is the same as or quite close to operating income. Net income before taxes doesn’t include noncash items, such as depreciation or income generated from financial investments, and usually doesn’t include the effects of discontinued operations or extraordinary items that the company might have reported.
Finally, the net profit margin tells you how much a company makes after it pays all its expenses and taxes. Net income after taxes is reported on a company’s income statement, and the net profit margin is calculated like this:
% Net Profit Margin = (Net Income After Taxes / Total Revenue) * 100
The net profit margin is the bottom line of a company’s profitability. After all is said and done, purchasing shares in a company that can’t show a profit after paying expenses and taxes is purely speculation, not investing.
Let’s take a look at Home Depot’s profitability ratios based on its fiscal year ended on January 31, 2003. Using data extracted from its SEC 10-K filing by EdgarScan (http://edgarscan.pwcglobal.com), Table 4-7 shows the necessary figures from the income statement.
Table 4-7. Home Depot measures needed to evaluate profitability
|
Financial measure |
Value in millions |
|---|---|
|
Total operating revenue |
$58,247 |
|
Cost of goods sold |
$40,139 |
|
Operating income |
$5,830 |
|
Income before tax |
$5,872 |
|
Net income |
$3,664 |
First, calculate the gross profit of $18,108 by subtracting the cost of goods sold from total operating revenue, and then determine the gross margin by dividing gross profit by total revenue, as shown in Example 4-46.
Example 4-46. Calculating Home Depot’s gross profit and gross margin
Home Depot's Gross Profit = $58,247 - $40,139 = $18,108
Home Depot's Gross Margin = ($18,108 / $58,247) * 100 = 31.1%
Next, divide operating income by total revenue to determine the operating margin, 10.0 percent. Divide income before tax by total revenue to determine the pre-tax profit margin of 10.1 percent, as shown in Example 4-47.
Example 4-47. Calculating Home Depot’s operating margin and pre-tax profit margin
Home Depot's Operating Margin = ($5,830 / $58,247) * 100 = 10.0%
Home Depot's Pre-Tax Profit Margin = ($5,872 / $58,247) * 100 = 10.1%
Finally, determine the net profit margin by dividing net income by total revenue, as shown in Example 4-48.
Example 4-48. Calculating Home Depot’s net profit margin
Home Depot's Net Profit Margin = ($3,664 / $58,247) * 100 = 6.3%
With these margins in hand, you can turn to the task of interpreting them. The best candidates for a long-term growth stock portfolio are usually those companies whose profit margins outperform those of the competition. Supermarkets, for instance, have very slim net profit margins. Retail businesses that thrive on high-volume sales often have low margins because of their low markups and competitive pressures. On the other hand, software makers and pharmaceutical companies typically have quite high margins. As a result, it would be a mistake to compare a software company’s margins to a grocery store’s and conclude that the software developer is a better investment purely on the basis of profit margins. Comparing a grocery store to its competitors gives you a clearer picture of its overall health. Table 4-8 shows the average profit margins for selected industries.
Table 4-8. 5-year industry average profitability ratios from Media General Financial Services (1998-2002)
|
Industry |
Gross margin |
Pre-tax margin |
Net margin |
|---|---|---|---|
|
Aerospace/defense |
16.0% |
3.0% |
1.8% |
|
Application software |
82.2% |
24.8% |
16.1% |
|
Auto manufacturers (major) |
29.1% |
2.8% |
1.7% |
|
Beverages (soft drinks) |
54.3% |
14.8% |
10.5% |
|
Discount and variety stores |
24.5% |
5.2% |
3.4% |
|
Drug manufacturers (major) |
72.4% |
22.2% |
16.7% |
|
Electric utilities |
42.3% |
6.3% |
-0.3% |
|
Grocery stores |
40.7% |
-0.2% |
-1.2% |
|
Life insurance |
N/A |
6.3% |
4.7% |
|
Major airlines |
51.3% |
-9.3% |
-7.1% |
|
Money center banks |
N/A |
23.9% |
17.1% |
|
Restaurants |
37.4% |
8.2% |
5.2% |
If a company’s profit margins trail the average profit margins of its industry by a significant amount, you should investigate further to determine the cause. Often, you can find explanations for shortcomings by reading the management discussion in the company’s annual report, SEC Form 10-K or 10-Q, or by asking the company’s investor relations representative directly. Successful companies always strive to maintain or even improve their margins in any number of ways. They can improve productivity, cut costs, or increase the volume of sales. In crisis mode, a company’s tactics to protect its margins could include layoffs, closing factories, or eliminating unprofitable product lines. If these actions don’t work, a company’s margins could erode until their net profit margins reach negative territory—which is another way of saying that the company is losing money.
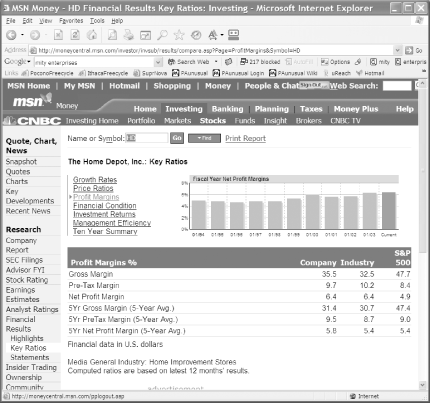
The MSN Money web site (http://money.msn.com) provides a quick way to compare profitability ratios for a company and its industry, as shown in Figure 4-15. Enter the ticker symbol and click Go, then Financial Results, and then Key Ratios. Click the Profit Margins link. In Home Depot’s case, the company’s profit margins are above average for the home improvement store industry.
Tip
No two companies are alike, and that’s particularly true for their profit margins. Minor differences between a company and its competitors aren’t usually something you need to sweat about. If you see significant variances, though, you’ve probably found evidence of weakness or strength.
It’s also important to compare a company’s recent results to its historical averages. Stable profit margins are a sign of solid management expertise, an indication that the company is successfully squaring off against competition, managing its raw materials and manufacturing costs, and generally staying the course. Conversely, wildly erratic or declining margins are often indications of trouble.
EdgarScan’s extracted financial data provides the numbers you need to calculate margins for several years. In the spreadsheet in Figure 4-16, you can easily trace the trends in Home Depot’s margins over a five-year period. In addition, you can compare the most recent year’s margins to the company’s five-year averages. If the company’s recent margins are below average, then it might be a sign that the company’s future is not so bright, although Home Depot has nothing to worry about in this area.
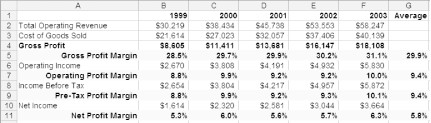
Figure 4-16. Looking at five years of Home Depot’s profit margins clues you in to the stability of the company
When looking at a company’s history, be aware of changes that might be caused by economic factors and not a specific weakness within the company. Cyclical businesses typically see their margins decline during down cycles, but they then recover along with the economy.
Tip
Sometimes, even a company’s strong performance can be cause for concern. Exceptionally high profit margins are good news for a company—at least for a while. However, high profit margins attract competition that might figure out how to provide similar products or services at a lesser cost, forcing the company to lower its prices, thereby putting pressure on its margins. When that happens, there’s no place for a company’s margins to go but down.
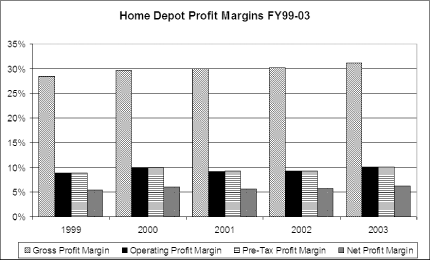
After you’ve collected the data and calculated profit margins in a spreadsheet, it’s easy to draw a picture to tell the story better. In Excel, insert a chart [Hack #13] and select the column type. For the data range, select cells A through F in rows 1, 5, 7, 9, and 11. Title the chart, and you’ll end up with something that looks like Figure 4-17.
In addition to MSN Money, you can also find profit margins for companies and industries calculated at Reuters Investor (located at http://www.investor.reuters.com).
Smart Money, “Digging into the Numbers” (http://university.smartmoney.com/departments/strategicinvesting/stockpicking/index.cfm?story=digging)
—Douglas Gerlach
Get Online Investing Hacks now with the O’Reilly learning platform.
O’Reilly members experience books, live events, courses curated by job role, and more from O’Reilly and nearly 200 top publishers.

