Examine a company’s financial strength to avoid the 98-pound weaklings that can wreck your portfolio performance.
Examining a company’s financial statements isn’t a lot of fun (unless you’re an accountant or attorney general), but there’s plenty of worthwhile information to be derived from a closer look at the balance sheet and income statement. There’s no need for a lot of number crunching, though—a handful of ratios can give you a good snapshot of a company’s fiscal fitness.
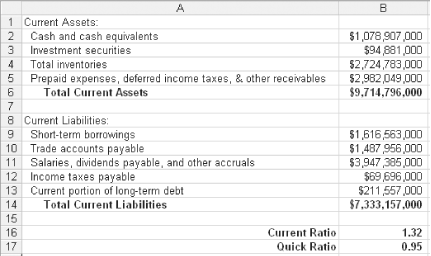
The most common test of a company’s financial strength is its current ratio (also called the working capital ratio). The current ratio, shown in Example 4-22, assesses a company’s ability to pay off debts that are due in the next twelve months from readily available assets, including cash on hand, accounts receivable, and inventory.
Current assets and liabilities come from a company’s balance sheet, which is a financial statement required for each quarterly and annual SEC filing. Be sure to use Total Current Assets and Total Current Liabilities, not Total Assets and Total Liabilities, which include illiquid assets, such as plants and equipment, and long-term debt. Figure 4-10 calculates the current ratio using the balance sheet entries for current assets and liabilities.
Current ratios can vary significantly by industry, but acceptable values usually range from 2.0 to 7.0 for a typical manufacturing company. This means that companies have current assets somewhere between two and seven times their current liabilities, and shouldn’t have any problems paying their bills if business drops off for a short period.
A current ratio below 1.5 could be a red flag that a company might face liquidity problems in the coming months. For example, if unexpected expenses arise or revenue drops, a company might have to borrow money or sell longer-term assets to pay the bills. If the current ratio is below 1.0, the company has negative working capital, which is usually a bad sign.
These rules of thumb don’t apply to companies in industries that operate primarily on a cash basis with low levels of inventories and accounts receivable. For instance, the reported inventory at a restaurant chain such as McDonald’s or retailers such as Wal-Mart or Amazon is usually quite low. These companies convert their inventories to cash quickly—sometimes even before they pay their suppliers. To these companies, selling their inventory before they’ve paid for it is like an interest-free source of capital. A low current ratio is a sign that these companies are operating at a high level of efficiency. Table 4-2 shows current ratios for companies in several industries.
Because it can take some time for companies to convert warehouses full of goods into cash, you can use a more stringent test to measure a company’s financial strength by using current assets minus inventories. The quick ratio (sometimes known as the acid test or liquidity test) reveals how well companies can generate cold cash in a short amount of time, and is calculated using the formula in Example 4-23.
Example 4-23. Formula for the quick ratio
Quick Ratio = (Current Assets - Inventory) / Current Liabilities
In Figure 4-10, the quick ratio in cell B17 is calculated by subtracting the Total Inventories in cell B4 from the Total Current Assets in B6, and then dividing the result by the Total Current Liabilities in cell B14, as shown in Example 4-24.
As with the current ratio, the quick ratio isn’t really applicable to cash-based businesses. For most other companies, the quick ratio should usually be greater than 1.0, and the higher, the better (although the average will vary by industry).
There are several ways that a public company can raise cash to expand and grow its business. It can sell shares of stock, issue bonds with a promise of repayment somewhere down the road (and paying interest along the way), or it can borrow money directly from a bank or other financial institution. Each method has its advantages and disadvantages, so company management has to decide how best to raise the working capital they need to achieve their business objectives.
For instance, company debt, whether bonds or bank loans, always has to be repaid along with interest on the outstanding principal. If a company can borrow money at 8 percent, invest those funds in expanding their operations, and generate a return of 12 percent on the investment, the company comes out ahead. They have successfully leveraged their debt to grow faster than they otherwise would have been able to.
But what happens if a company can’t generate a rate of return on the borrowed money equal to the interest rate on the debt? Or, business deteriorates and the company has trouble covering its interest payments? In these situations, companies might have to cut costs to the detriment of further growth or take resources away from business operations to pay interest and pay back principal. Either way, the debt decreases growth instead of increasing it.
For these reasons, investors should evaluate a company’s total debt and determine whether it can successfully manage its debt load. The debt-to-equity ratio is the place to start.
The debt-to-equity ratio compares the total debt of a company to its shareholder’s equity. You can find both figures on a company’s balance sheet. Shareholders’ equity, also known as book value, is at the very bottom of a balance sheet and is calculated by subtracting liabilities from assets. Shareholder’s equity is the amount that owners have invested in a company plus the total of any retained earnings. You’ll probably have to add up several figures to come up with a company’s total debt. In Example 4-25, total debt is the sum of short-term borrowings, current portion of long-term debt, and long-term debt, which equals $6,144,525,000.
Example 4-25. An excerpt showing debt on a balance sheet
Current Liabilities:
  Short-term borrowings                                           $1,616,563,000
  Trade accounts payable                                          $1,487,956,000
  Salaries, dividends payable & accruals                           $3,947,385,000
  Income taxes payable                                               $69,696,000
  Current portion of long-term debt                                  $211,557,000
      Total Current Liabilities                                    $7,333,157,000

Long-Term Debt                                                    $4,316,405,000
After you’ve calculated total debt and shareholders’ equity, you can calculate the ratio, as shown in Example 4-26.
Example 4-26. Formula for the debt-to-equity ratio
Debt-to-Equity Ratio = Total Debt / Shareholder's Equity
Debt-to-equity is sometimes expressed as a decimal, but more often as a percentage. To calculate the ratio as a percentage, multiply the formula in Example 4-26 by 100.
The lower the debt-to-equity ratio, the greater a company’s financial safety. Some investors completely avoid investing in companies that have any debt whatsoever. That’s certainly an easy way around the question of “How much debt is too much?” But debt isn’t always a bad thing. A general rule of thumb is that a debt-to-equity ratio greater than 40 or 50 percent requires closer scrutiny of the company’s general financial health. If interest rates rise or revenues fall, these companies might have trouble paying their debts. If such a company also has low quick ratios and current ratios, it might have liquidity problems that drive it to overextend its credit line.
You should also consider whether a company’s debt is growing or shrinking. A company might have a good reason for increasing its debt load, such as a national expansion plan to build new stores across the country. However, a company that borrows more and more to merely sustain its operations is usually a sign of trouble. On the other hand, a business that decreases its debt year after year is usually a good sign of increasing financial strength.
The debt-to-equity ratio considers all of a company’s debt, including short-term borrowing and the portion of long-term debt that must be paid back within the next twelve months. The long-term debt-to-equity ratio includes only the debt that the company will pay off more than twelve months in the future, such as mortgages and business loans.
Long-term debt usually appears on its own line in a company’s balance sheet, as illustrated in Example 4-25, so the calculation is very straightforward, as shown in Example 4-27.
Example 4-27. Formula for the long-term debt-to-equity ratio
Long-Term Debt-to-Equity Ratio = Long-Term Debt / Shareholder's Equity
The trouble with the long-term debt-to-equity ratio is that companies can change their mix of short-term and long-term debt to make their current or total debt-to-equity ratios look more attractive. For this reason, it’s more prudent to evaluate a company’s debt load with the debt-to-equity ratio.
Another important financial strength ratio is interest coverage, which tells you how easily a company can pay the interest on its debt in the next twelve months from current profits. If a company has no debt, this ratio is irrelevant. The ratio is calculated using the formula shown in Example 4-28.
Example 4-28. Formula for interest coverage ratio
Interest Coverage = (Earnings Before Interest and Taxes) / Interest Expense
A company’s income statement will usually have a
line for interest expense, as shown in Example 4-29.
If the income statement doesn’t list Earnings Before
Interest and Taxes (EBIT), calculate EBIT by adding the interest
expense back into earnings before taxes. In Example 4-29, add Interest
expense to Income before Income Taxes to calculate EBIT of $2,507,000,000. In this example,
the interest coverage is $2,507,000,000 divided by $41,000,000 for a
result of 61.1.
Example 4-29. An excerpt from an income statement
Interest expense                                                     $41,000,000
Total Expense And Other Income                                     $5,532,000,000
Income Before Income Taxes                                         $2,466,000,000
Interest coverage is a good indicator of a company’s short-term health. A high interest coverage ratio means that a company is not likely to default on loans and bond payments, whereas interest coverage below 1.0 means that a company is having trouble generating the cash to make its interest payments. Most investors consider an interest coverage ratio below 1.5 as a serious red flag. Companies with interest coverage in the range of 4.0 to 5.0 are usually in good shape. Blue-chip companies, such as the one in Example 4-29, easily make debt payments, so values higher than 5.0 don’t tell you much more.
You should examine companies with falling interest coverage to determine the cause. It is not a good sign if the ability to cover interest payments decreases.
Tip
In many cases, you can find these financial strength values calculated for you already on web sites such as Yahoo! Finance (http://finance.yahoo.com) or MSN Money (http://money.msn.com). However, their figures might differ from values you calculate yourself using SEC filing data you download from a source such as EdgarScan (http://edgarscan.pwcglobal.com). The discrepancies might be due to how numbers are rounded or how current the data is. When you calculate the ratios yourself, you’ll gain greater insight into their meaning.
Bob Adams’s “Analyzing the Annual Report” (http://www.bobadams.homestead.com/bobsite.html) includes many of these ratios, along with red flags that warn of trouble areas.
Smart Money, “Digging into the Numbers” (http://university.smartmoney.com/departments/strategicinvesting/stockpicking/index.cfm?story=digging)
—Douglas Gerlach
Get Online Investing Hacks now with the O’Reilly learning platform.
O’Reilly members experience books, live events, courses curated by job role, and more from O’Reilly and nearly 200 top publishers.

