Because stock screens blindly follow the criteria tests and cut-off values you specify, they can omit companies that almost meet your criteria. By using looser screening criteria, you’ll end up with more results, but you can use Excel or online features to compare financial measures and then decide for yourself which companies to keep. Downloading screen results to a spreadsheet gives you the most flexibility, because you can bring all of Excel’s features into play to evaluate your contestants. However, if you use Quicken.com’s stock screens, the Compare Stocks feature displays the financial measures for all the screen results in a table on the Web.
If you download results data to a spreadsheet, be sure to display all the columns of data you want to evaluate before you create the spreadsheet. Whether you use the MSN Money Deluxe Screener [Hack #5] , the Reuters Investor Power Screener, or another stock screen that downloads results, add, remove, or rearrange columns in the results on the web page. For example, using the MSN Money Deluxe Screener, you choose View→Column Set Displayed→Customize Column Set on the screener’s menu bar. Then, you can select columns and click Add, Remove, Move Up, or Move Down to modify the columns in your results.
With the data for the companies that pass your criteria stored in a spreadsheet, you can sort and filter based on any of the data in the spreadsheet with much more flexibility than that provided by online tools. Because you’re playing directly on your computer, you don’t have to worry about dropped Internet connections or slow web site response. If you use the MSN Money Deluxe Screener, choose File→Export→Results To Excel and then click OK. The spreadsheet opens in Excel with a default filename, so you’ll have to choose File→Save As in Excel to save it to the folder you want on your computer.
Tip
The exported results file opens in Excel as a comma-delimited file. Before you save the file, be sure to change the file type to an Excel workbook.
With the online screening tools, you can typically sort by only one column at a time. Although you can sort using up to three columns in Excel, it’s not much help, because sorting by multiple columns implies duplicate entries in the first and second sort column. Because these spreadsheets contain financial measures to at least one significant digit, you won’t see much duplication, but the capability is there if you need it. To sort the results in Excel, follow these steps:
Select a cell in the spreadsheet. If you know which column you want to sort by, select the label for that column.
Choose Data→Sort.
In the Sort By box in the Sort dialog box, select the label for the column by which you want to sort in the drop-down list. For example, as a fundamental investor, you might sort by EPS growth. If you selected the label cell before you opened the dialog box, Excel selects that column automatically as the sort field.
Because higher growth rates are more desirable, select the Descending option, so the results appear from highest to lowest growth.
Click OK.
Excel enables you to filter the rows that appear in your spreadsheet. If you run a stock screen that produces several dozen companies, you can turn Excel filters on and off quickly, or filter by more than one column at a time. For example, you can apply a filter to find the companies with great growth rates, then filter for companies with strength (low debt, good inventory turnover ratios, and more). Filtering rows is faster and more flexible than changing criteria in a stock screen, so it’s a great way to see which companies keep showing up as you look for desirable characteristics.
Let’s filter a results screen to see how it can help evaluate a number of potential investments. Follow these steps to define and refine filters:
Select a cell on the spreadsheet—any cell will do.
Choose Data→Filter→AutoFilter. Down arrows appear in each column heading in the spreadsheet.
To define a filter for a column, click its Down arrow. For example, to filter for companies with reasonable levels of debt, click the Down arrow in the Debt to Equity Ratio column. The AutoFilter drop-down list includes all the values that appear in cells in the column as well as other filter options.
To specify a filter test, choose (Custom...) from the drop-down list. The Custom AutoFilter dialog box appears.
Choose the comparison operator from the drop-down list in the first box. For example, to show companies with debt to equity ratios less than 30 percent, choose “is less than or equal to.” In the box on the right, type
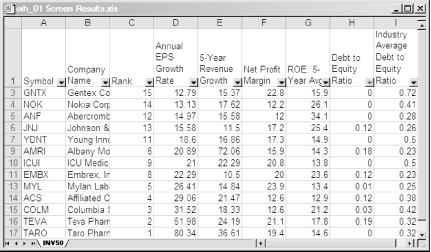
.3(for 30 percent) for the value for the test.Click OK. Only rows with companies that meet the debt to equity ratio filter criteria appear, as shown in Figure 1-7.
To apply another filter, click the Down arrow in another column. For example, these companies have grown quickly over the past several years, so let’s filter out the lower revenue growth rates. Click the Down arrow for 5-Year Revenue Growth, and choose (Custom...) on the drop-down list. Choose “is greater than or equal to,” and type
20in the value box. The rows that appear in the spreadsheet show the companies that meet the filters set for both columns.To turn a column filter off, click the Down arrow in that column, and then choose (All) from the drop-down list.
Get Online Investing Hacks now with the O’Reilly learning platform.
O’Reilly members experience books, live events, courses curated by job role, and more from O’Reilly and nearly 200 top publishers.

