6.6. Performance Counters
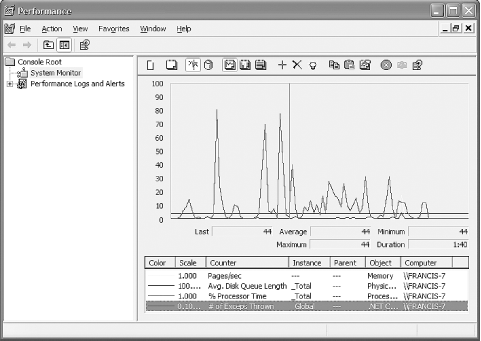
Tucked away in the Administrative Tools folder within the Control Panel is the infamous Windows Performance Monitor. For years, network administrators have used this tool (shown in Figure 6-2) to profile everything from network traffic, SQL Server performance, memory, threads, and the cache. It is a very useful tool made even better by several additional counters provided by .NET.
Figure 6-2. The extremely useful Performance Monitor

These supplementary counters allow you to profile low-level processes such as CLR memory allocation and the JIT compiler. In addition, ASP.NET provides several useful counters for keeping an eye on sessions, requests, and the cache.
6.6.1. .NET CLR Exceptions
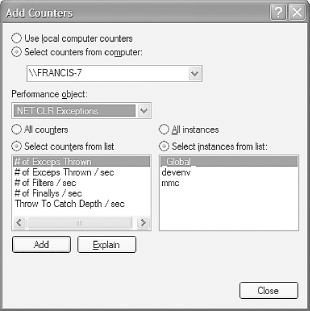
ASP.NET also provides a counter for monitoring exceptions thrown by the CLR. You can add it to the performance monitor by right-clicking on the performance graph and selecting "Add Counters" from the context menu. This step will bring you the dialog shown in Figure 6-3.
Figure 6-3. Adding performance objects to the monitor

Then in the Performance object drop-down listbox, select ".NET CLR Exceptions." This category contains several counters, including "# of Exceps Thrown." There are several instances of this counter: _Global_, zero or more devenv counters, and
Get Object-Oriented Programming with Visual Basic .NET now with the O’Reilly learning platform.
O’Reilly members experience books, live events, courses curated by job role, and more from O’Reilly and nearly 200 top publishers.

