Time for action – drawing a filled contour plot
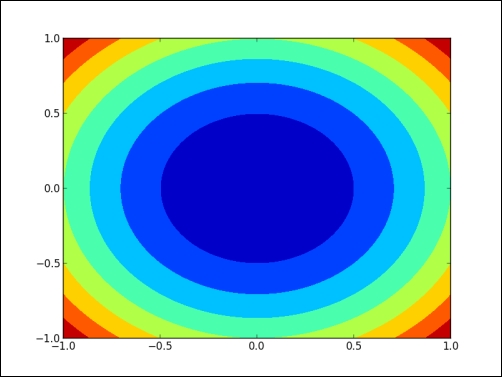
We will draw a filled contour plot of the three-dimensional mathematical function in the previous Time for action section. The code is also pretty similar. One key difference is that we don't need the 3D projection parameter any more. To draw the filled contour plot, use the following line of code:
ax.contourf(x, y, z)
This gives us the following filled contour plot:
What just happened?
We created a filled contour plot of a three-dimensional mathematical function (see contour.py):
import matplotlib.pyplot as plt import numpy as np from matplotlib import cm fig = plt.figure() ax = fig.add_subplot(111) ...
Get NumPy : Beginner's Guide - Third Edition now with the O’Reilly learning platform.
O’Reilly members experience books, live events, courses curated by job role, and more from O’Reilly and nearly 200 top publishers.

