Time for action – plotting the Kaiser window
Let's plot the Kaiser window:
- Call the NumPy
kaiser()function:window = np.kaiser(42, 14)
- Plot the window with matplotlib:
plt.plot(window)
plt.show()
The Kaiser window appears as follows:
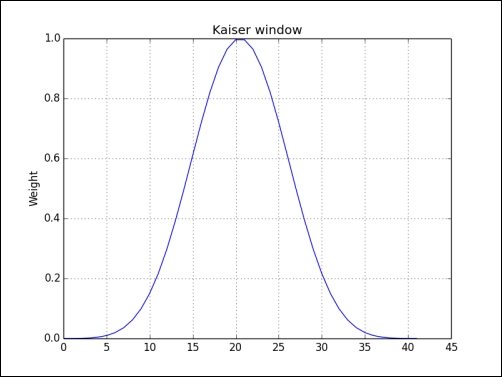
What just happened?
We plotted the Kaiser window with the NumPy kaiser() function.
Get NumPy : Beginner's Guide - Third Edition now with the O’Reilly learning platform.
O’Reilly members experience books, live events, courses curated by job role, and more from O’Reilly and nearly 200 top publishers.

