Chapter 26
Pivot Tables
When you have a large database and you want to discover trends and patterns at a glance, you can use PivotTable reports to help you. Pivot tables allow you to:
- Summarize the data contained in large tables into a compact layout.
- Find relationships within the data that are hard to evaluate because of a vast amount of data.
- Organize the data into a format that can be charted easily.
First you have to decide what questions you want the data to answer. To construct a pivot table you need to identify these two elements in your data:
Certain constraints exist:
- In the first row of the data, each one of the columns should have a unique header (or label).
- There should be no empty rows or columns within the range of data used for the report. Each column should contain only one type of data: text in one column and numeric values in a separate column.
PIVOTTABLE EXAMPLE
This section will start with a simple example using the database employed previously. See Figure 26.1 for the database. In this example, you will want to calculate the average age by gender and job.
FIGURE 26.1 Simple Database Used in a PivotTable
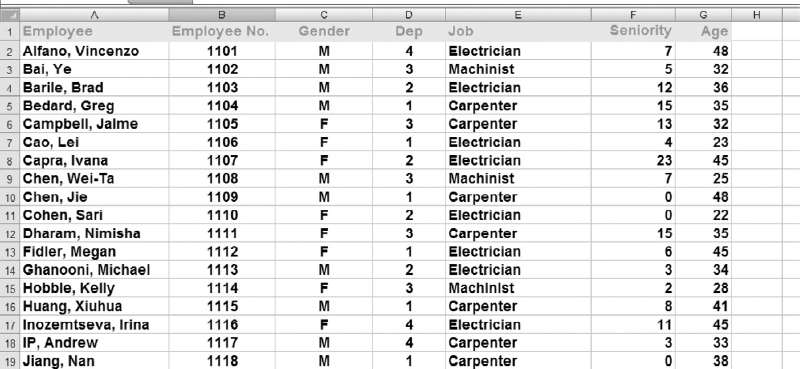
To start the PivotTable, select any cell (or range of cells) in the database and click on the PivotTable ...
Get Next Generation Excel: Modeling In Excel For Analysts And MBAs (For MS Windows And Mac OS), 2nd Edition now with the O’Reilly learning platform.
O’Reilly members experience books, live events, courses curated by job role, and more from O’Reilly and nearly 200 top publishers.

