Chapter 18
Using Scroll Bars for Sensitivity Analysis
Data tables, as shown in the last chapter, are excellent tools for sensitivity analysis. One problem you may encounter when using them—especially if you want to analyze many inputs’ parameters—is that you have to create a number of tables to have an extensive analysis. As data tables are limited to a maximum of two variables for any output, it may be difficult to view a few or all the tables simultaneously, and it might become a difficult undertaking.
A different solution to modify the input is to use scroll bars. Scroll bars were created in Excel for changing values in forms. You are going to harness the power of these scroll bars to change input values in the financial statements of decision-making models, analyzing the impact of these changes on the output.
To illustrate this idea go back to our car loan example used in the last couple of chapters. See Figure 18.1. This loan example has a number of inputs: price, down payment, years, and interest rate. We used the data tables and varied the rate and the number of years to explore the effect of their changes on the output.
FIGURE 18.1 The Car Loan Example
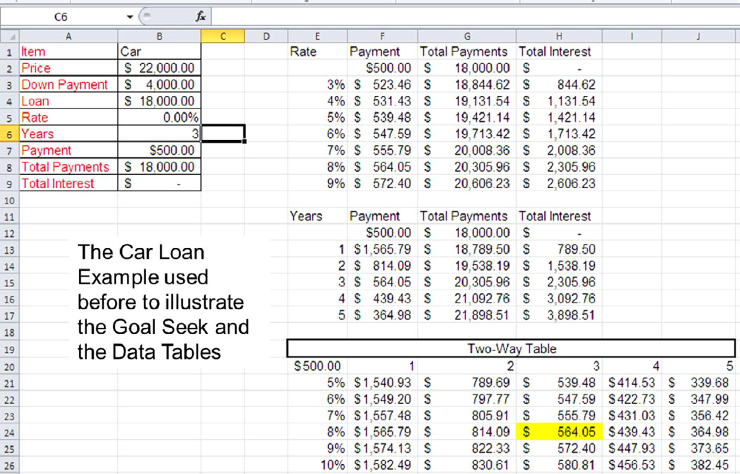
I will demonstrate the way to use the scroll bar instead of—or in addition to—the data table. The first value you are going to link to a scroll bar is the number of years or the duration of the loan.
To create scroll bars ...
Get Next Generation Excel: Modeling In Excel For Analysts And MBAs (For MS Windows And Mac OS), 2nd Edition now with the O’Reilly learning platform.
O’Reilly members experience books, live events, courses curated by job role, and more from O’Reilly and nearly 200 top publishers.

