Chapter 10
Descriptive Statistics
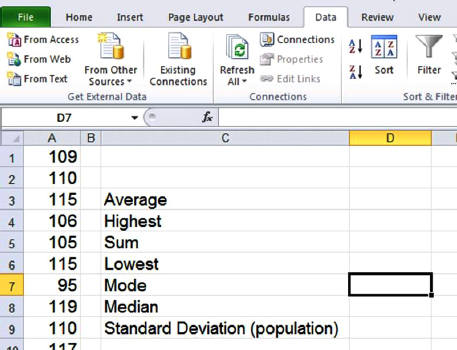
In this chapter, I start with statistical analysis of the data on the sheet called Statistics in the Excel workbook Chapter 10 shown in Figure 10.1.
FIGURE 10.1 Data on the Sheet “Statistics”
The data in column A contains a list of 500 students’ IQs. I selected the range A1:A500 and named the range “DATA.” I used the procedure described in Chapter 4. If you expand the name box above A1 by clicking the drop-down arrow/menu to the right of the field and then select the name DATA, it will highlight the range of named cells A1:A500.
DESCRIPTIVE STATISTICS
In this section I am going to calculate several frequently used statistics functions. I will start with the mean, the highest value, the lowest value, the standard deviation, the median, and the mode.
Let me begin with the average. I select the cell D3 where I would like the answer to be located, and then select fx (Insert function) or use Shift+F3. Choose the category Statistical, then the function Average. See Figure 10.2.
FIGURE 10.2 Insert Function, the Average
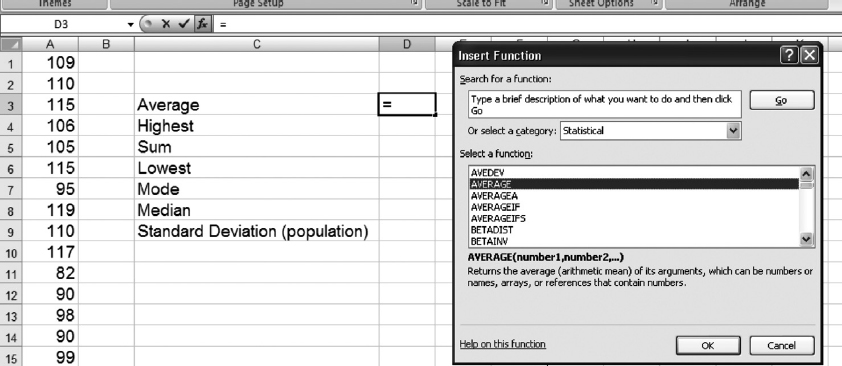
A menu to insert the function arguments will appear—since the goal is to compute the average of our data set, I could select the range A1:A500, but as the range was previously named DATA, I can simply type in the word DATA and click OK ...
Get Next Generation Excel: Modeling In Excel For Analysts And MBAs (For MS Windows And Mac OS), 2nd Edition now with the O’Reilly learning platform.
O’Reilly members experience books, live events, courses curated by job role, and more from O’Reilly and nearly 200 top publishers.

