Chapter 7
Sparklines and Advanced Topics in Excel Charts
Charts were discussed in chapter 6. This chapter first describes the new feature Sparklines in Excel 2010 and Mac Excel 2011, then it will deal with special chart topics, and lastly it will present charts using mathematical formulas in Excel.
SPARKLINES
Sparklines were introduced in Excel 2010/11. They are micro charts in cells. There are three kinds of Sparklines: Lines, Columns, and Win/Loss. You will find them under the Insert Ribbon for 2010 or the Charts Ribbon in Mac Excel 2011. Figure 7.1 shows a line of data and three different Sparkline types produced from the data. The left side of the figure displays the icons used to create them.
FIGURE 7.1 Sparkline Types in Excel 2010 and MAC Excel 2011
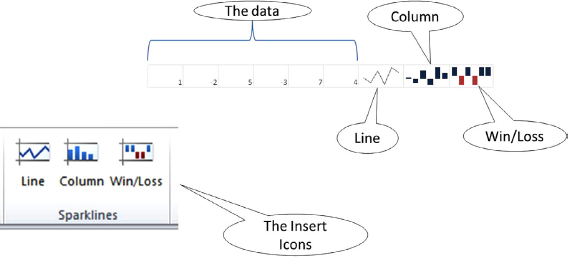
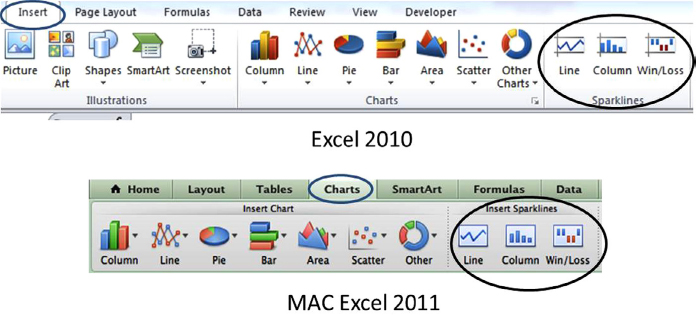
Figure 7.2 shows where to find the Insert Sparklines Icons.
FIGURE 7.2 Insert Sparkline Icon Locations
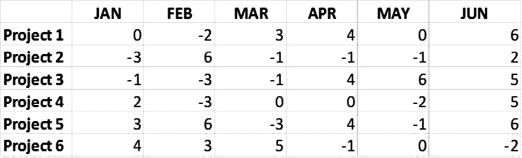
The following example demonstrates how to use Sparklines. Consider the following data for six months. The data is profit or loss for the period of January through June. See Figure 7.3.
FIGURE 7.3 Data for Six Months
To create the Line Sparkline first select the cell J2 where you want your Line Sparkline to be. Click on the ...
Get Next Generation Excel: Modeling In Excel For Analysts And MBAs (For MS Windows And Mac OS), 2nd Edition now with the O’Reilly learning platform.
O’Reilly members experience books, live events, courses curated by job role, and more from O’Reilly and nearly 200 top publishers.

