Chapter 6
Excel Charts
Charts convey much more information than just reading spreadsheet data. Charts make it easier to see what is hiding behind the numbers. In this chapter, you are going to find out how to generate and format Excel charts. I will demonstrate how to use some of the different types of charts and the common techniques to deal with all Excel charts.
QUICK/INSTANT CHART
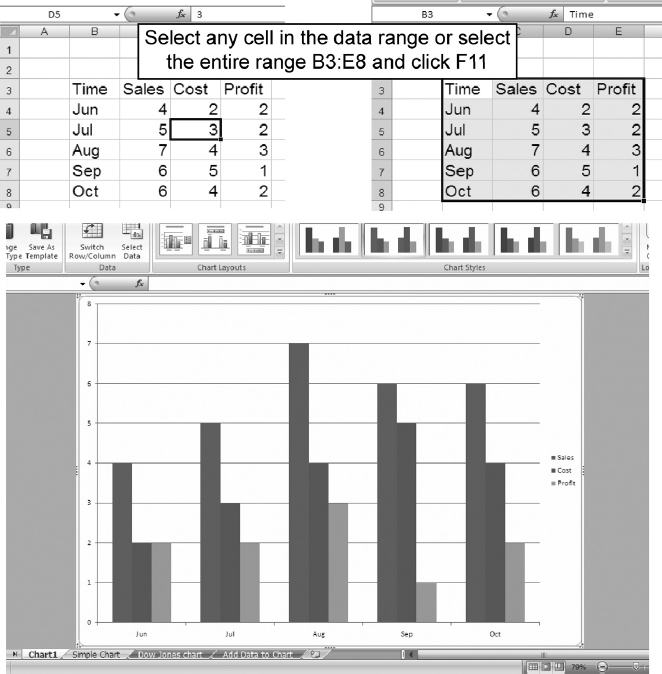
To get a quick/instant chart from data in Excel, select any cell in the data range as shown in Figure 6.1 (alternatively select the entire range B3:E8) and press the F11 key. When you use the F11 key, it generates a clustered column chart (the default chart) on a new sheet. You will find it on the sheet Simple Chart in the Excel file Chapter 6.
FIGURE 6.1 The F11 Key Creates an Instant Chart
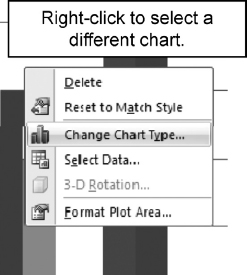
If you wish to change the default chart type after Excel created it, right-click on an empty space inside the chart, and then select Change Chart Type in the local menu. A window with chart options will pop-up and allow you to select a different chart type. See Figure 6.2.
FIGURE 6.2 Right-Click to Change Chart Type
Here is an alternate way to select a different chart type. When you create a chart, Chart Tools appear on the ribbon. This Chart Tools ribbon shows Design, Layout, and Format tabs. Click on the Design ...
Get Next Generation Excel: Modeling In Excel For Analysts And MBAs (For MS Windows And Mac OS), 2nd Edition now with the O’Reilly learning platform.
O’Reilly members experience books, live events, courses curated by job role, and more from O’Reilly and nearly 200 top publishers.

