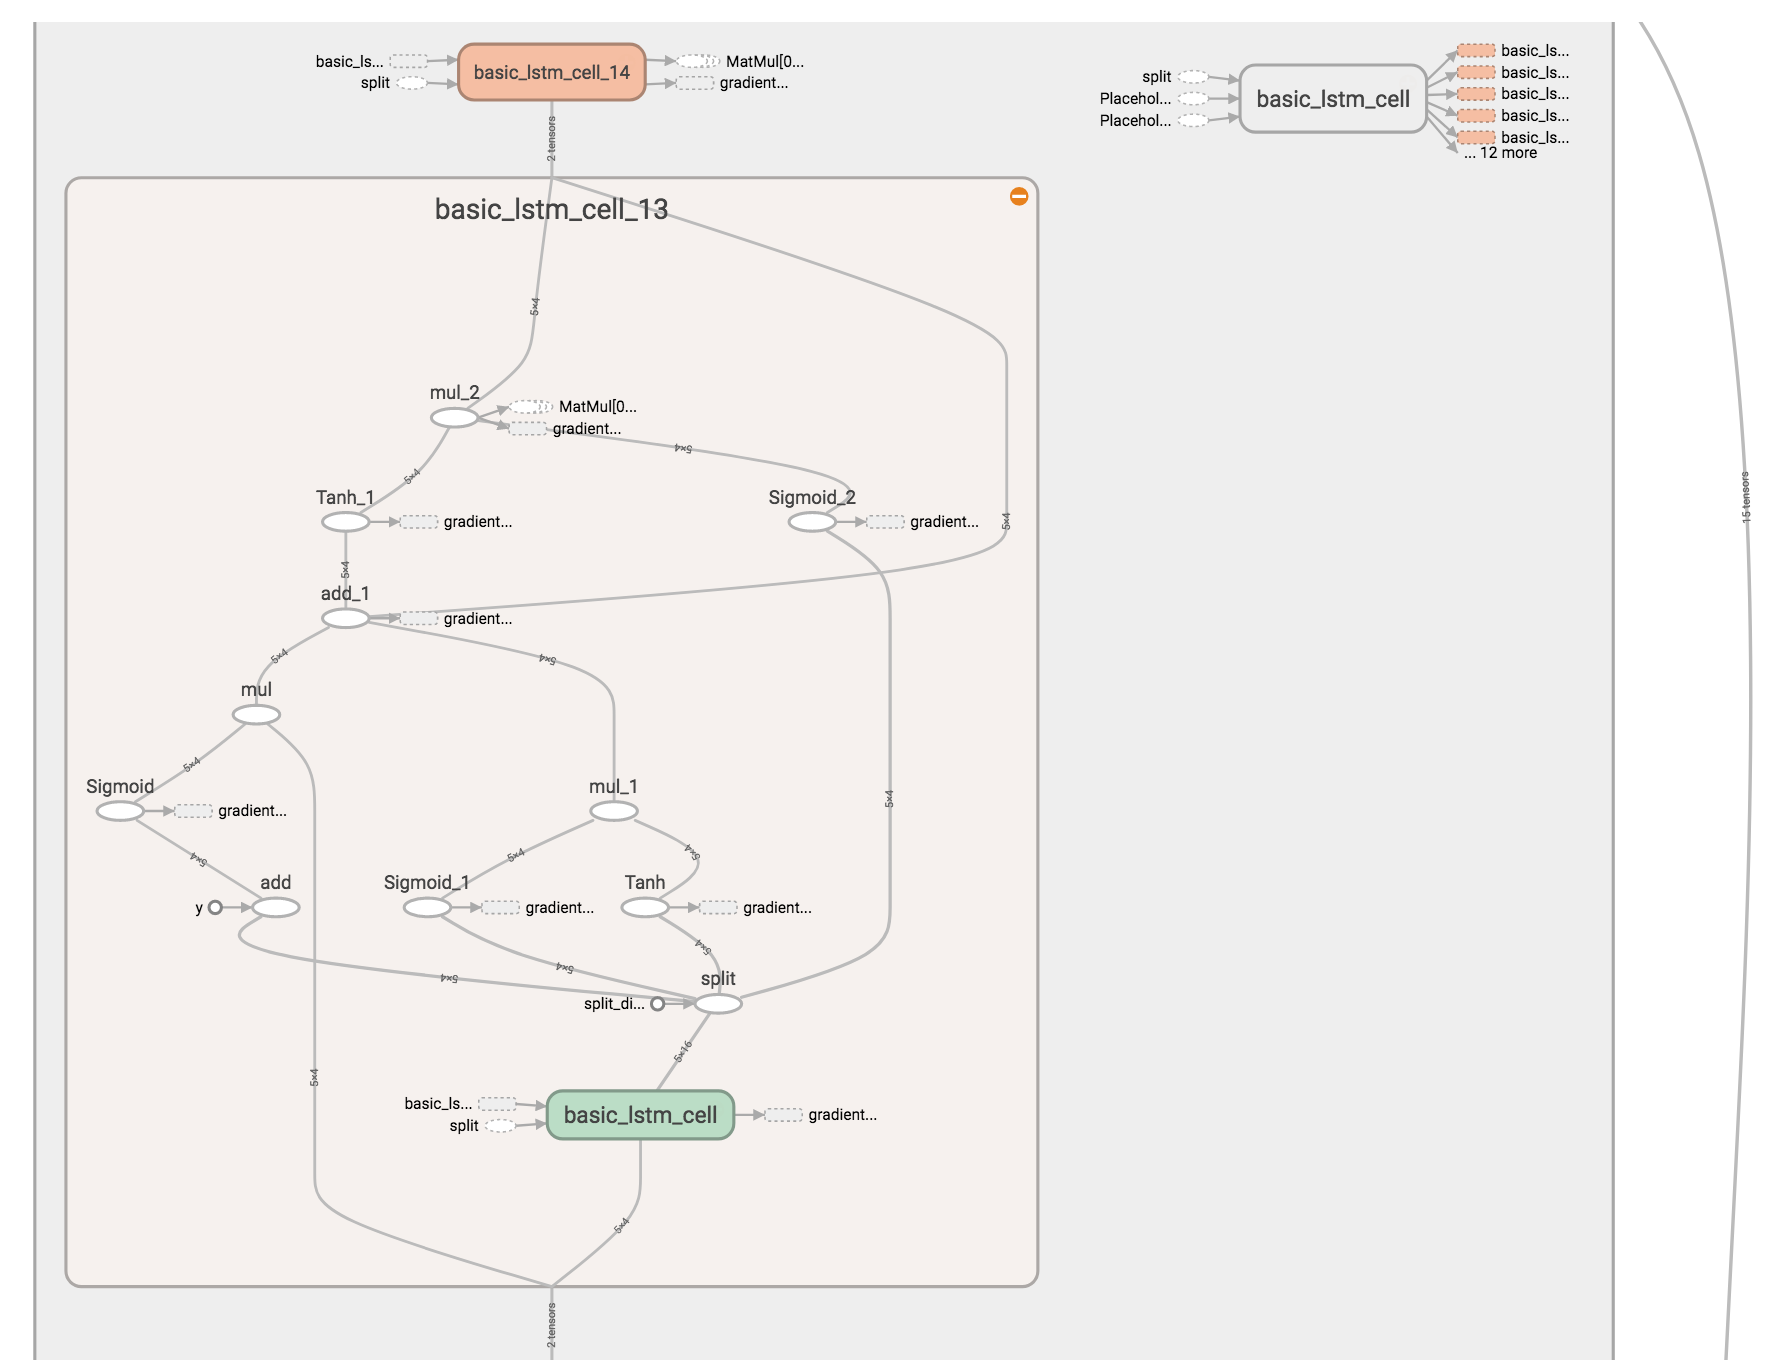
The following computational graph from TensorBoard describes the working of the LSTM network:
The output of the listing is shown as follows:
New data, epoch 0Step 0 Loss 0.696803Step 600 Loss 0.00743465New data, epoch 1Step 0 Loss 0.404039Step 600 Loss 0.00243205New data, epoch 2Step 0 Loss 1.11536Step 600 Loss 0.00140995New data, epoch 3Step 0 Loss 0.858743Step 600 Loss 0.00141037

