Real programmers know that watching their applications run smoothly isn’t nearly as much fun as just getting them to run in the first place. The best part is seeing what’s going on under the hood. Don’t you just love to watch the threads weaving around, and the values in one variable affecting another like a chain of dominos falling over? Well, the people at NetBeans understand, so they created some great debugging features. In the event that you make a programming error and can’t immediately see what’s wrong, you can use these debugging features to find out what’s really going on. But I’m sure you’re more careful than that, so just think of debugging as a fun diversion from writing code. Here are some of the ways you can play with the inner workings of your programs while they’re running:
Set breakpoints
Watch values change for variables and expressions
Examine and modify variable values
Step through code, line by line
Examine running threads, classes, and the callstack
Run several debugging sessions at the same time
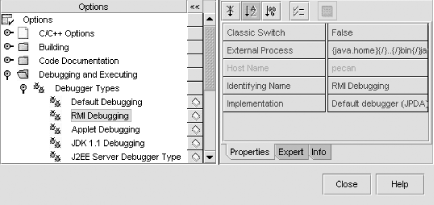
Actually, the same user interface supports a choice of backend debugging facilities. The Java Platform Debugger Architecture (JPDA) is the default. Be sure to specify the right debugger type for the object to be debugged; these types are delineated in Table 4-1.
Table 4-1. Debugger types that come with NetBeans 3.3
|
Debugger type |
Remarks |
Where to use it |
|---|---|---|
|
Default |
Based on JPDA |
Use with ordinary Java applications |
|
Applet |
Based on JPDA |
Required with applets |
|
JDK 1.1 |
Pre-JPDA, fewer features |
Use only with pre-Java 2 applications |
|
RMI |
Based on JPDA |
Use with RMI applications |
|
J2EE server |
Based on JPDA |
Use with J2EE Server Integration |
You can see the various debugger types for NetBeans in Figure 4-1.
Originally, setting a breakpoint simply told the debugger to stop execution at a specified source code line and to enter into an interactive debugging mode. But NetBeans (with JPDA) does much more than that. Setting a breakpoint now means responding to a variety of runtime events, listed in Table 4-2. The user can configure the response to each breakpoint to include either or both of the following actions:
Suspend debugging pauses execution to allow the user to use the interactive debugging features.
Print text displays a fully configurable message in the output window.
Table 4-2. Runtime events that can be used to trigger a breakpoint define the following breakpoint types
|
Breakpoint type |
Runtime event |
Options—specify when to activate breakpoint |
|---|---|---|
|
Line |
Execution reaches line in source |
Condition—optional boolean expression |
|
Method |
Execution enters method |
Apply also to anonymous inner classes, or to named classes only Apply to all methods of given classes, or only selected methods Condition—optional boolean expression |
|
Exception |
Exception is thrown |
Exception caught, uncaught, or both Condition—optional boolean expression |
|
Variable |
Variable is accessed or modified |
All access to variable, or modification only Condition—optional boolean expression |
|
Thread |
Thread starts or dies |
Thread start, thread death, or both |
|
Class |
Class is loaded or unloaded |
Class loaded, unloaded, or both |
The Condition option is probably the most interesting. You may enter a boolean expression as the Condition property in the dialogs for setting Line, Exception, Variable, and Method breakpoints. Start your application in debug mode, and it will ignore the breakpoints until the conditional expression evaluates to true. This saves lots of time, compared to stepping over breakpoints manually until you reach the conditions that you want to investigate.
There are some scope considerations in creating a breakpoint condition. With these considerations in mind, a breakpoint condition can be any valid Java expression that appears on the right side of the equals sign in an assignment statement with a boolean variable on the left side. Additionally:
Variables and expressions in the Condition must be valid within the class, method, or line that the breakpoint is set in.
“Import” statements are ignored, so external references must be fully qualified (e.g., use java.lang.String, instead of simply String).
Outer class methods and variables are not directly accessible, so they also must be fully qualified (e.g., use this.variableName or this$1.variableName).
Let’s have some fun and try out some of the debugging features. But first we need something to debug. Here’s a little multithreaded class, shown in Example 4-1. Each thread simply displays a counter while counting to a limit. You may follow along with this example or use one of your own and do the same exercises. If you want to use this one, create a package named Debug under some working directory that you’ve mounted in the NetBeans Explorer. Download the source from the book’s web site, or type it in manually.
Example 4-1. Multithreaded example for debugging demo—ThreadedCounter.java
package Debug;

/**
 * Multithreaded example for debugging demo.
 *
 * @author  vaughn
 */
public class ThreadedCounter {

/** thread sleep delay interval for CountThread */
  private static long delay = 500;

/** number of iterations for 1st instance of CountThread */
  private static int maxcount = 20;

/** inner class object to run as a separate thread */
  private class CountThread implements Runnable {

/** number of iterations for CountThread */
    private int maxcount = 1000;

/** identifying name for instance of CountThread */
    private String countName;

/** iteration counter */
    private int count;

/** CountThread constructor */
    public CountThread(String name, int maxcount) {
      super( );
      this.maxcount = maxcount;
      this.countName = name;
      new Thread(this).start( );
    }

/** run method for thread */
    public void run( ) {
      for (count = 0; count < maxcount; count++) {
          try {
              Thread.sleep(delay);
          } catch (InterruptedException e) {}
          System.out.println(countName + " = " + count);
      }
    }
  }

/** ThreadedCounter constructor */
  public ThreadedCounter(String name, int limit) {
    System.out.println(name + " limit = " + limit);
    CountThread ct = new ThreadedCounter.CountThread(name, limit);
  }

  /**
  * @param args the command line arguments
  */
  public static void main (String args[ ]) {
    new ThreadedCounter("1st", maxcount);
    new ThreadedCounter("2nd", 10);
  }
}
Compile and execute ThreadedCounter, just to see
what it does. Not much, but enough for our purposes. Both threads
display the current count every half second. The second thread counts
from 0 to 9 and then quits, whereas the first thread counts all the
way to 19.
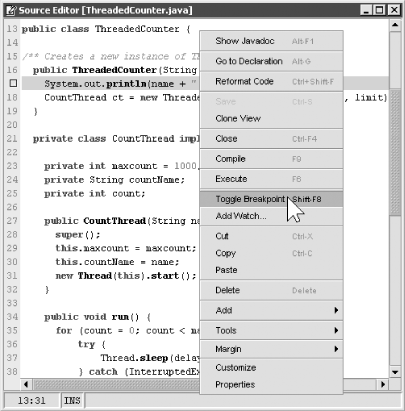
Now let’s set some breakpoints. First, set
breakpoint type Line at the line that starts with
System.out.println in the
ThreadedCounter constructor. As usual, there are
several ways to do this. Open ThreadedCounter in
the Source Editor, and put the cursor on the line with
System.out.println. Right-click to get the context
menu (shown in Figure 4-2), or open the Debug menu in the main window. Select
Toggle Breakpoint from either menu.
Or you could just put the cursor on the desired line and press
Shift-F8. Notice that the line is
highlighted in pink after the breakpoint has been set.
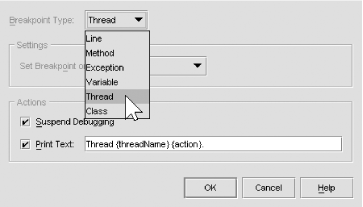
To see something a bit more interesting let’s set a breakpoint type Thread. Select Add Breakpoint from the Debug menu, or press Control-Shift-F8 to pop up the Add Breakpoint dialog box (shown in Figure 4-3). Select Breakpoint Type → Thread and then change the Set Breakpoint On property to Thread Start or Death.
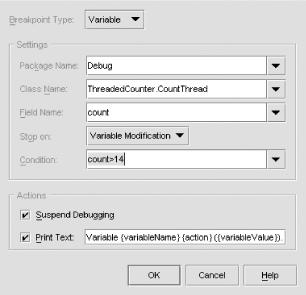
Finally, let’s set a breakpoint type Variable on the
count variable in the
CountThread inner class. This breakpoint type
might be better named breakpoint type Field,
because it only seems to work on variables with classwide scope. This
author could not get it to work for variables with a narrower scope,
such as internal to a for loop.
That’s why count in the code
example is declared as a class member, instead of within the
for loop. Click anywhere on the private int count; line and then press Control-Shift-F8. When the Add Breakpoint dialog box opens (illustrated
in Figure 4-4), make sure Breakpoint Type
→
Variable and Stop
On
Variable Modification
are selected. This time we’ll also set a condition.
Any valid boolean expression will work. Enter
“count>14.”
Before running the Debugger, let’s set
watches
on the count and
countName variables in the
CountThread inner class. A watch gives us a convenient way
to see the current value in a variable while the application is
running and the value keeps changing. Like setting breakpoints, you
could start from the Debug menu or
from the Source Editor with the mouse pointer positioned over the
variable to be watched. For this example, put the pointer over
count anywhere in the source, press Control-Shift-F7, then hit OK in the dialog box that pops up. Repeat with
countName. That’s all there is to
it. Now, we’re ready to debug.
You can start the Debugger from the Editing, GUI Editing, or Debugging workspace. The source to be debugged must be open and selected in the Explorer or Source Editor, just as if you intended to Execute the class. Select Start from the Debug menu (as shown in Figure 4-5), or press Alt-F5 to launch the Debugger. If you want the Debugger to pause at the first executable statement, press F7 to start it. Once it starts, the IDE switches to the Debugging workspace.
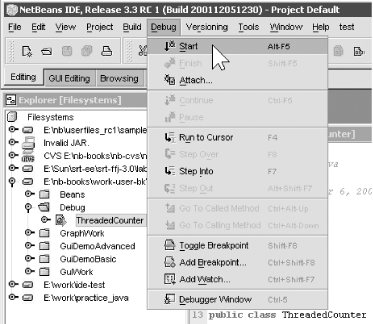
When the Debugger starts, the class being debugged executes normally until it hits a breakpoint. Then it pauses with the Source Editor window open and the breakpoint line highlighted. If the program flow does not hit a breakpoint, you can always seize control by selecting Pause from the Debug menu. In our example we also set a breakpoint on Thread Start or Death, so there will not be a highlighted line at the first few pauses. Just press Control-F5 to continue until it hits a breakpoint line. Then you can use Step Over, Step Into, and other standard debugger features to walk through the source. Table 4-3 is a summary of features available through the Debug menu.
Table 4-3. Debug menu options
|
Debug menu |
Shortcut keys |
Debugger action |
|---|---|---|
|
Start |
Alt-F5 |
Start Debugger session and switch to Debugger workspace. |
|
Finish |
Shift-F5 |
End Debugger session. |
|
Attach |
Debug a remote process. | |
|
Continue |
Control-F5 |
Resume execution until the next breakpoint. |
|
Pause |
Pause a running program that has not hit a breakpoint. | |
|
Run to Cursor |
F4 |
Resume execution until the program pointer reaches the location of the cursor in the source. |
|
Step Over |
F8 |
Execute to next line in current method or constructor. |
|
Step Into |
F7 |
Same as Step Over (F8), unless current line is a method call. In that case, pauses at the first executable line in the method. This works to start a new debugger session and pause at the first line of the main method. |
|
Step Out |
Alt-Shift-F7 |
Same as Step Over (F8), unless current line is in a method. In that case, executes normally through return and pauses in the calling source at the line after the method call. |
|
Go to Called Method |
Control-Alt-Up |
Move cursor in source to the current execution line in a called method. This only affects the cursor location, not the flow of execution. |
|
Go to Calling Method |
Control-Alt-Down |
Move cursor in source to the point from which the current method was called. This only affects the cursor location, not the flow of execution. |
|
Toggle Breakpoint |
Shift-F8 |
If the cursor is on a line that does not have a breakpoint set, set a breakpoint. Otherwise, clear the breakpoint. |
|
Add Breakpoint |
Control-Shift-F8 |
Open dialog to add several breakpoint types—Line, Method, Exception, Variable, Thread, Class. |
|
Add Watch |
Control-Shift-F7 |
Add a watch on a variable or expression. |
|
Debugger Window |
Control-5 |
Remember my remark at the beginning of this chapter that the best part of programming is seeing what’s going on under the hood? That’s why the NetBeans people gave us the Debugger Window. So start a debugging session, let it switch you to the Debugging Workspace, and we’ll look at what you can do with the Debugger Window. If the Debugger Window doesn’t open automatically, press Control-5 to open it. This window is shown in Figure 4-6.
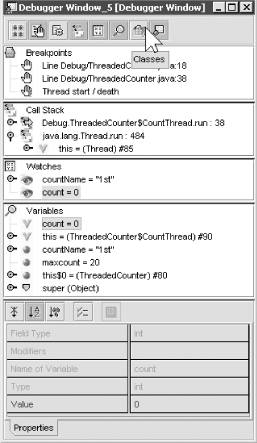
The Debugger Window has three sections:
- Toolbar
Buttons to toggle View Panels and Property Sheet off and on
- View Panels
Up to seven views of what’s going on under the hood of your programs
- Property Sheet
Property info on an object selected on a View Panel
The View Panels, which allow you to examine in depth the objects involved in running the object being debugged, include the following:
- Sessions
Shows all active debugging sessions. You can launch any number of simultaneous debugging sessions and switch back and forth among them.
- Breakpoints
Shows all breakpoints of every type set in all active sessions
- Threads
Shows all live threads in all active sessions
- Call Stack
Shows stack trace for each live thread in the currently selected session
- Watches
Shows all watches set on variables in all active sessions
- Variables
Shows all variables visible within scope of currently selected thread
- Classes
Shows classes visible in currently selected session
Use the debug functions for Continue, Step Into, and Step Over to
slowly execute our ThreadedCounter example. Notice
the values changing in the watches on the count
and countName variables. Separately, the Output
Window tracks execution progress by logging breakpoints that are hit.
Open up nodes in the panels to look as deeply as you like. Inspecting
the objects while they are
running reveals
what
the JVM is doing with the
classes that you’re debugging.
Let’s investigate the Variables view to see
what’s possible. You
should have a Debugger Session running with
ThreadedCounter, and the Debugger Window should be
open with the Variables panel and the Property Sheet visible. If
necessary, click the appropriate button in the Tool bar to make the
panels visible.
Press Control-F5 a few times to get
past startup and into the main execution phase. Continue until the
Watches or Variables panel shows count = 3. Click
the value for count, click again to edit it, and
change the value to count = 6.
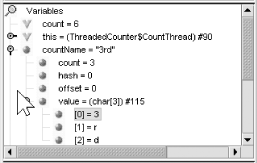
That’s how easy it is to examine and modify the
value of a variable during debugging. Try it with
countName. Change the value to
“3rd”, or whatever you like. Or, as
shown in Figure 4-7, open the nodes to expose the
individual characters, and change them one by one.
Any Java executable that can be run from the IDE can be debugged by it. This gives a developer the full range of NetBeans’ debugging power for working with standalone applications, applets, and client applications that are based on a variety of technologies. The NetBeans debugger can also attach to a Java process already running in a separate JVM, either on the same computer or on a remote machine. This gives a developer the same power for debugging remote applications and components running in Java-based server containers.
Attaching to a remote JVM makes it possible to use breakpoints,
conditionals, watches, and other debugging features with servlets,
Enterprise JavaBeans, and RMI or CORBA server objects. Debugging
remote objects without such features requires inserting a myriad of
System.out.println( ) statements or other logging
code. Using logging code for debugging is slow and inefficient,
whereas using NetBeans is much more powerful.
Start the JVM that you want to debug with the following switches:
java -Xint -Xdebug -Xnoagent -Xrunjdwp:transport=dt_socket,server=y,
  address=12999,suspend=n ...
-
-Xint Turn off Hotspot optimizations. Although this is not strictly necessary, it does make the JVM far more stable while debugging.
-
-Xdebug Turn on debug mode.
-
-Xnoagent Disable the old sun.tools.debug.
-
-Xrunjdwp Specify connection details:
transport=dt_socket: tell the JVM to allow a remote debugger to connect via socket. Alternatively,transport=dt_shmemallows the remote debugger to connect over shared memory, which requires that the debugger be on the same machine as the JVM. As of NetBeans 3.2.1, it seems that onlydt_socketis supported.server=y: tell the JVM to wait for a remote debugger to attach to it. Alternatively,server=nwould cause the JVM to try to attach to a remote debugger.address=12999: specify port number to listen on. This can be any port that you have permissions to. Remember this port because you will need it to configure NetBeans later.suspend=n: if this is “y,” it causes the JVM to suspend before the main class is loaded.
-
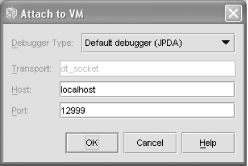
Start NetBeans.
Select Debug → Attach from the menus.
In the Attach window (shown in Figure 4-8) select the Default Debugger, the host you are connecting to, and the port on that machine that you specified when you started the JVM.
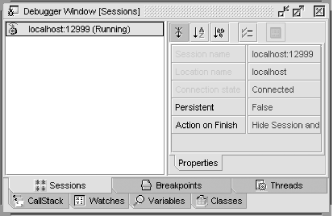
In your NetBeans output window, you will see
Connecting to localhost:12999. You will be able to see your connection in the Sessions tab of the Debugger Window, shown in Figure 4-9.Use the NetBeans Debugger just as you would a local debugging session.
Connecting to a separate JVM, especially across a network to a remote machine, is significantly more complex behind the scenes and has more possibilities for problems. Nevertheless, the advanced debugging features more than make up for any extra patience and effort that the following issues may require.
If you attach to debug a JVM and then disconnect, you will not be able to reconnect unless you restart your JVM. It seems that a given JVM will only accept one debugger connection while it is running.
In Debug mode, your JVM may be much slower, because it needs to send a record of all method calls to the debugger.
In Debug mode, your JVM will also be very unstable. Make sure that you have
-Xintspecified to disable Hotspot optimizations. You may also want to add-Djava.compiler=NONEto turn off the Just-In-Time (JIT) compiler.Conditional breakpoints with complex conditions may not work.
If you have the source code of your server software, you can even debug into the server code. For example, open source projects such as JBoss, an Enterprise JavaBeans Container (found at http://www.jboss.org), and Tomcat, a Java Servlet engine (found at http://jakarta.apache.org), provide you with the source code of their servers. If you mount that code as a filesystem in NetBeans, you can debug into that code as well (you need not compile the code for this to work). Note that the version of the code must match exactly with that of the running software (i.e., trying to debug JBoss 2.4.0 with the source from JBoss 2.4.1 will not work).
Now that you have the tools for getting out of trouble, you’re ready for more interesting ways to get into trouble. The chapters ahead will give you ample opportunity to get well acquainted with the NetBeans debugger as we look at increasingly sophisticated tools and technologies for building Java applications and components with NetBeans.
Get NetBeans: The Definitive Guide now with the O’Reilly learning platform.
O’Reilly members experience books, live events, courses curated by job role, and more from O’Reilly and nearly 200 top publishers.

