Report 2: Pie Chart
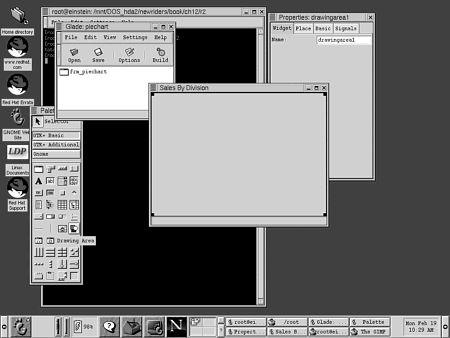
This second report will be a pie chart display of sales by division. Obviously, this type of display best lends itself to displaying a limited number of values, normally between 2 and 15. A pie chart that attempts to show more than that becomes too fragmented to show anything but the largest slices, if the data breaks out as such. Figure 12.3 shows Glade highlighting the DrawingArea widget, which will be used extensively in the next three reports. Listing 12.6 is the code for the pie chart report.
Figure 12.3. The pie chart project is under construction with Glade; the DrawingArea widget is highlighted in the palette.

Get MySQL Building User Interfaces now with the O’Reilly learning platform.
O’Reilly members experience books, live events, courses curated by job role, and more from O’Reilly and nearly 200 top publishers.

