Docker metrics
For each container, Zabbix discovers the following metrics that will be recorded:
- Container (your Containers name) is running
- CPU system time
- CPU user time
- Used cache memory
- Used RSS memory
- Used swap
Apart from "Used swap", these are the same metrics recorded by cAdvisor.
Create custom graphs
You can access a time-based graph for any of the metrics collected by Zabbix; you can also create your own custom graphs. In the following graph, I have created a graph that plots all the CPU System stats from the three web containers we launched earlier in the chapter:
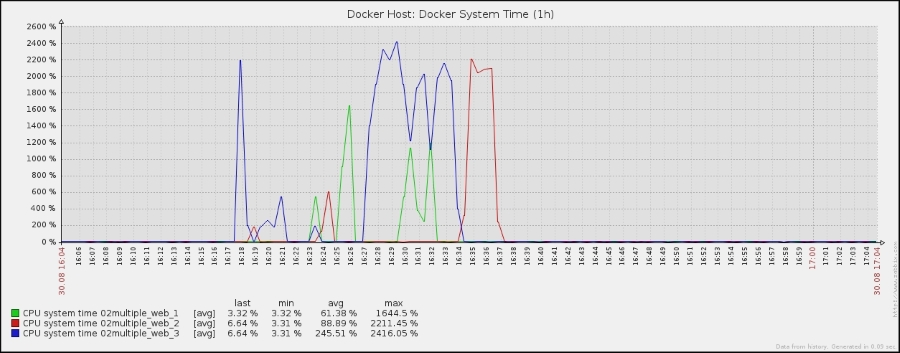
As you can see, I performed a few tests using ApacheBench to make the graph a little ...
Get Monitoring Docker now with the O’Reilly learning platform.
O’Reilly members experience books, live events, courses curated by job role, and more from O’Reilly and nearly 200 top publishers.

