Designing Charter
When you look at a chart like the one shown in the previous section, you can identify a number of standard elements that are used by all types of charts. These elements include a title, the x and y axes, and one or more data series:
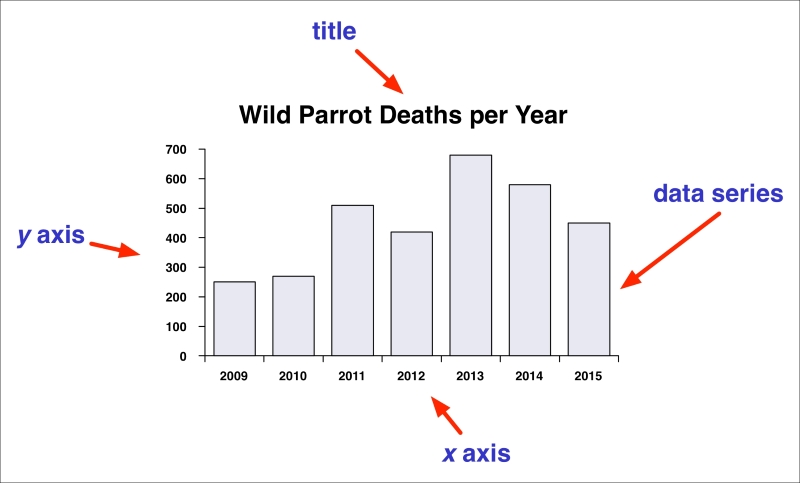
To use the Charter package, a programmer would create a new chart and set the title, the x and y axes, and the data series to be displayed. The programmer would then ask Charter to generate the chart, saving the result as an image file on disk. By combining and configuring the various elements in this way, a programmer can create any chart that they may wish to generate.
Note
A more sophisticated charting ...
Get Modular Programming with Python now with the O’Reilly learning platform.
O’Reilly members experience books, live events, courses curated by job role, and more from O’Reilly and nearly 200 top publishers.

