Appendix D
Thermodynamic Charts
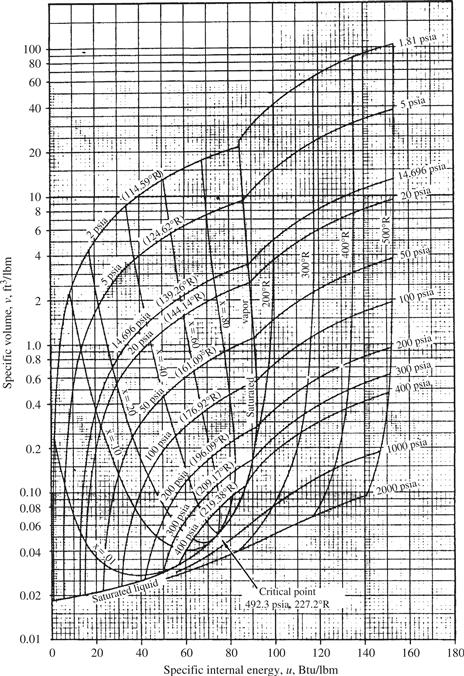
Figure D.1 v-u chart for nitrogen. Based on National Bureau of Standards TN-129A. Sources: Reprinted by permission from Reynolds, W. C., Perkins, H. C. Engineering Thermodynamics, second ed., 1977, McGraw-Hill, New York.
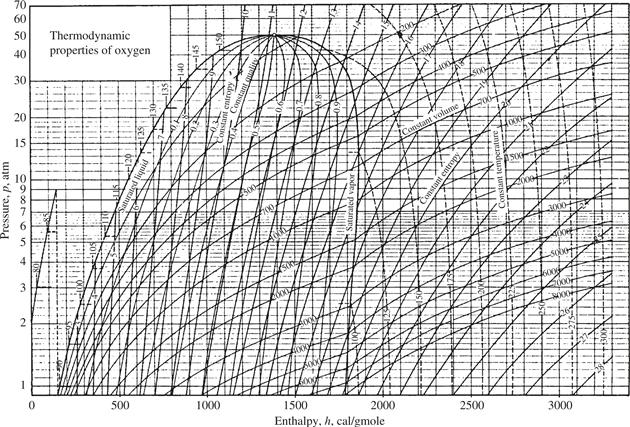
Figure D.2 p-h Chart for oxygen. From NBS D-2573. 1 cal = 4.184 joules, v in mL/gmole, T in K, s in cal/(gmole![]() ·K). Also reprinted by permission from Reynolds, W. C., Perkins, H. C. Engineering Thermodynamics, ...
·K). Also reprinted by permission from Reynolds, W. C., Perkins, H. C. Engineering Thermodynamics, ...
Get Modern Engineering Thermodynamics now with the O’Reilly learning platform.
O’Reilly members experience books, live events, courses curated by job role, and more from O’Reilly and nearly 200 top publishers.

