6.12. RELATIONSHIP BETWEEN CLOSED-LOOP FREQUENCY RESPONSE AND THE TIME-DOMAIN RESPONSE
Section 6.10 has illustrated how the closed-loop frequency-domain response may be obtained from the open-loop transfer function. The next logical question to ask is how to determine the relationship between Mp and the peak overshoot one obtains in the time domain. In Chapter 4, we defined the time at which the peak overshoot occurs as tp in terms of ζ and ωn [see Eq. (4.29)]. For example, does an Mp of 1.3 mean a 30% transient overshoot in the time domain?
Table 6.20. MATLAB Program to Obtain the Nichols Chart for the System whose Open-Loop Transfer Function is shown in Eq. (6.121)
| num = [780 1344.8273] den = [1 30.5747 217.2414 114.9425 0] a = −[.25:.25:1 2 5 10:10:170 179.99]; b = [−24 − 18 − 12 − 9 − 7 − 5: − 1 −.5:.25:.5 1:5 7 9 12]; [x,y] = nichgrid([−360 0 − 24 36],a,b,3); [mag, ph] = bode(num,den,logspace(-1,2)); plot(ph,20 * log10(mag)); W = [5 1 2 5 7 9 12]; [mag, ph] = bode(num,den,w); plot(ph,20 * log10(mag),‘ * g’) title(‘Nichols Frequency Response Plot’) |
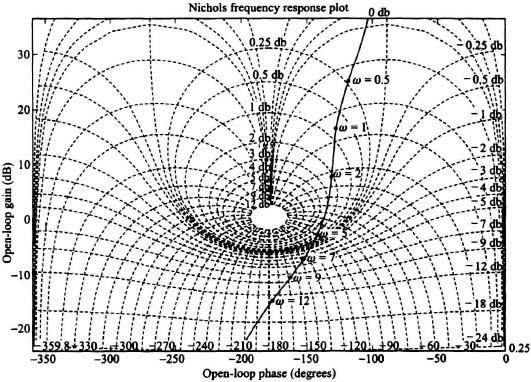
Figure 6.52 Nichols chart with ![]() superimposed.
superimposed.
This problem has been analyzed for the general, unity-feedback system of Figure 6.45 [22 ...
Get Modern Control System Theory and Design, 2nd Edition now with the O’Reilly learning platform.
O’Reilly members experience books, live events, courses curated by job role, and more from O’Reilly and nearly 200 top publishers.

