This is a important graphic, where we identify how the salary diversity is between genders across the history of organisation. Here we use average salary as a basis for the analysis.
| UI Location | Graphic | Description |
| Sidebar | 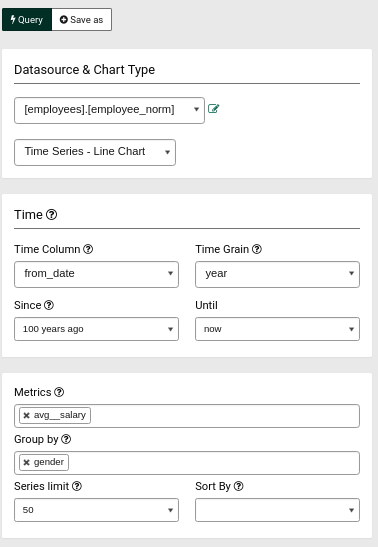 |
Datasource & Chart Type: select [employees].[employee_norm] as the datasource and Time Series - line chart as chart type
In the Time section, select birth_date as Time Column & 100 years ago as since column. In the Metrics section, select avg_salary as the Metric and gender as Group By. |
| Output | 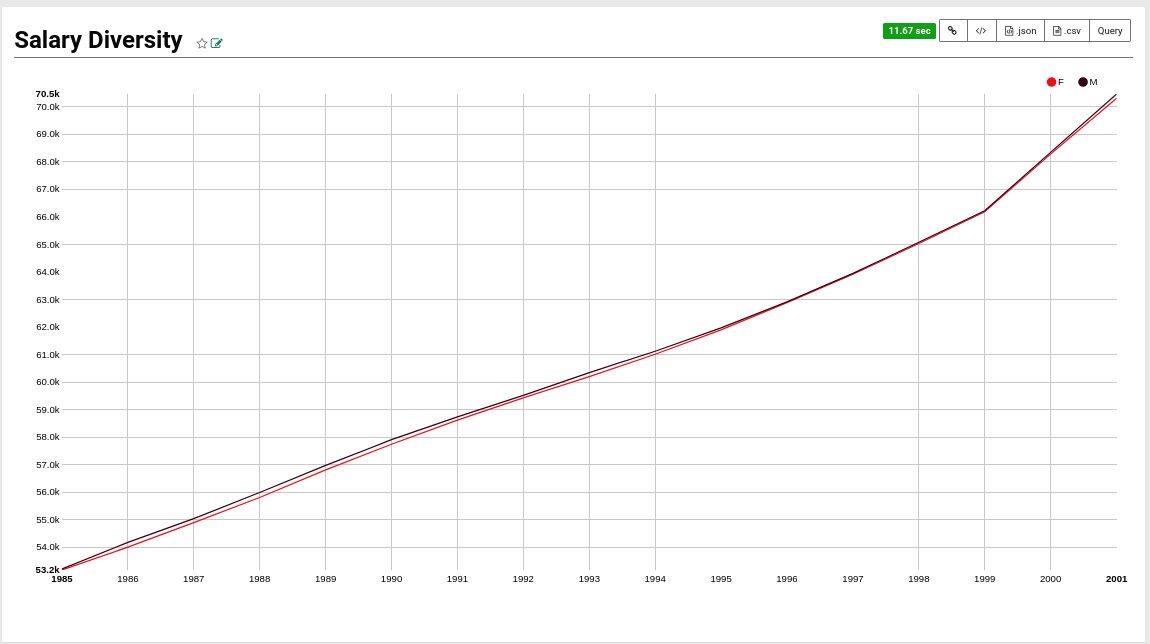 |
Graphic ... |

