Chapter 6. Charts
Patterns: Chart with Filters, Overview + Data, Scrolling with Preview, Data Point Details, Drill Down, Zoom In, Pivot Table, Sparklines
Mobile chart design inherits many of the same guidelines and best practices as print and desktop chart design. A great introductory book for this topic is The Wall Street Journal Guide to Information Graphics: The Dos and Don’ts of Presenting Data, Facts, and Figures, by Dona M. Wong. I also recommend Stephen Few’s books on chart design.
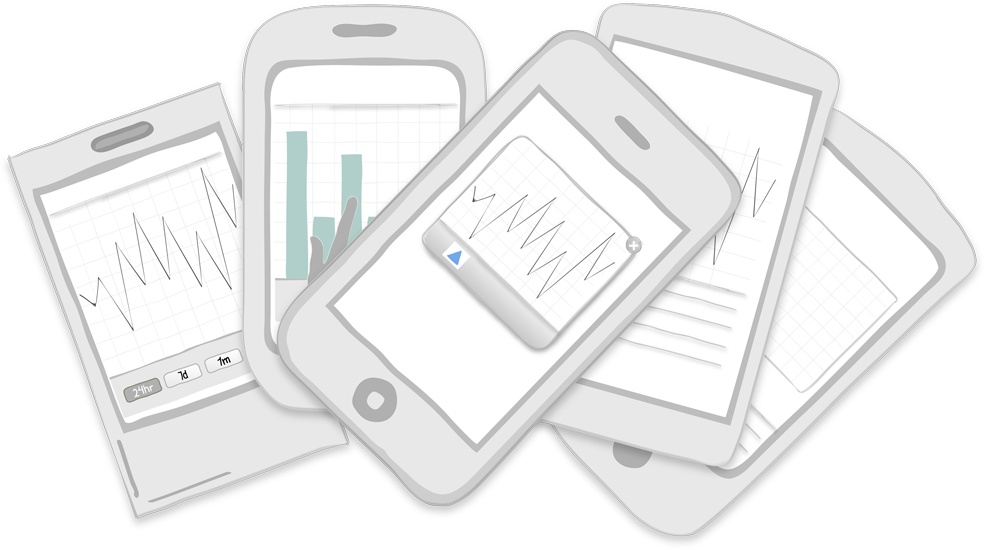
All of these patterns build on a basic chart design. At a minimum, charts should include a title, axis labels, and data. The data may be displayed as a pie, bar, column, area, line, bubble, scatter plot, bullet, radar, gauge, or mixed chart. Depending on the type of chart, a legend may be necessary.
Some basic charts are used in RunKeeper Pro and GasLog to illustrate a runner’s pace over the course of their run, and cost of gas over time, respectively.
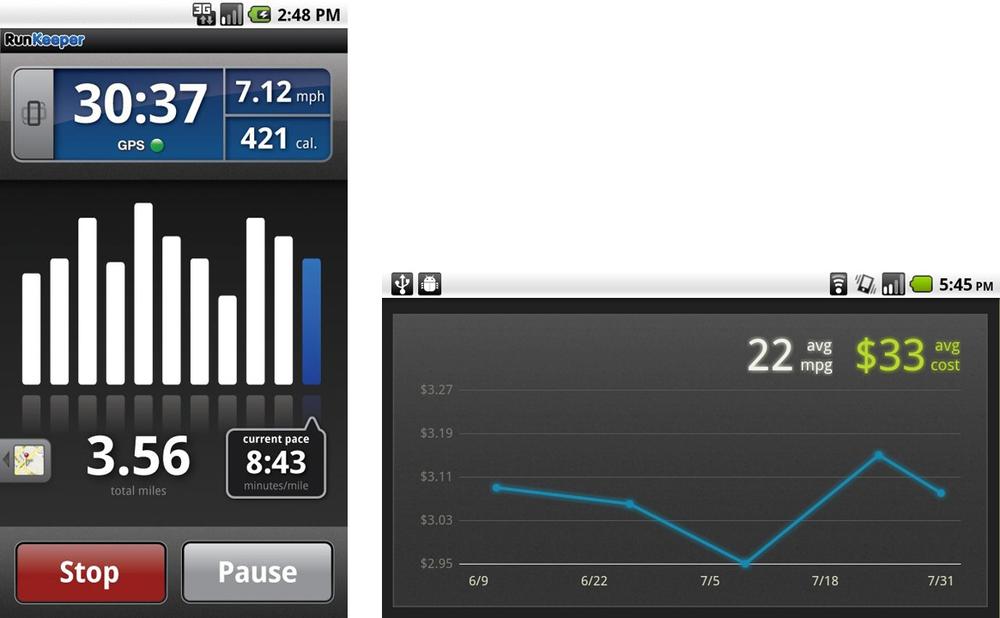
Figure 6-1. RunKeepr Pro and Gas Log
Once the basic chart design is established, watch for Chart Junk that might sneak in. Chart Junk refers to visual elements in charts and graphs that are not necessary to comprehend the information represented on the graph or that distract the viewer from this information [wikipedia]. See Chapter 10, for more information ...
Get Mobile Design Pattern Gallery, Color Edition now with the O’Reilly learning platform.
O’Reilly members experience books, live events, courses curated by job role, and more from O’Reilly and nearly 200 top publishers.

