Solving the Problem of the Two Phenomena
Now that we've identified one of the main causes of these two related phenomena, there are several ways that we might tackle the problem. The following options also include discussions by Hawkins in Chapters 2 and 9 that readers might have missed.
FIGURE 13.3 The same 5m DAX chart with two additional curves launched from the low and high price values.
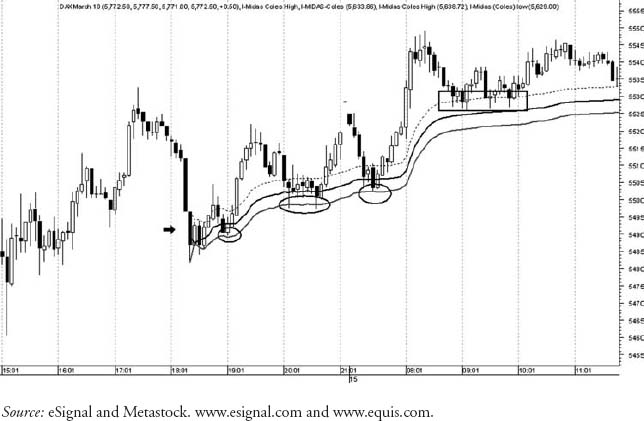
Option #1: Using the High and Low
The first obvious solution is to add the two high and low curves of Figure 13.3 to the default “average price” MIDAS curve I've been using throughout this book. Indeed, one might suggest removing the “average price” curve ...
Get MIDAS Technical Analysis: A VWAP Approach to Trading and Investing in Today's Markets now with the O’Reilly learning platform.
O’Reilly members experience books, live events, courses curated by job role, and more from O’Reilly and nearly 200 top publishers.

