The Debug Menu and Toolbar
The Debug menu and its related toolbar provide your first-level access to starting debug sessions, stepping into code, managing breakpoints, and accessing the many features of debugging with Visual Studio. There are two states to the debug menu: at rest (or inactive) and in debug mode. Figure 11.12 shows the menu in the at-rest state.
Figure 11.12 The Debug menu outside of a debug session.
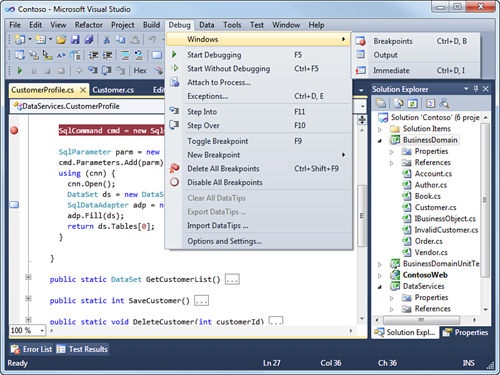
In the at-rest state, the Debug menu provides features to start a debug session, attach code to a running process, or access some of the many debug windows. Table 11.1 lists all the features available from the Debug menu at rest.
Get Microsoft® Visual Studio® 2010 Unleashed now with the O’Reilly learning platform.
O’Reilly members experience books, live events, courses curated by job role, and more from O’Reilly and nearly 200 top publishers.

