V.3.1. Generating Sophisticated Output with Report Designer
The Report Designer is part of the SQL Server Business Intelligence Development Studio (BIDS) and is used to create reports. A report is a formatted output from your database.
If you remember running queries by using T-SQL statements in the SQL Server Management Studio, you know those outputs are rather plain and simple. With Report Designer, not only can you spice up your reports with graphics and different layouts, but you can also create interactive reports by using sophisticated tools, such as a matrix (described in the following paragraphs).
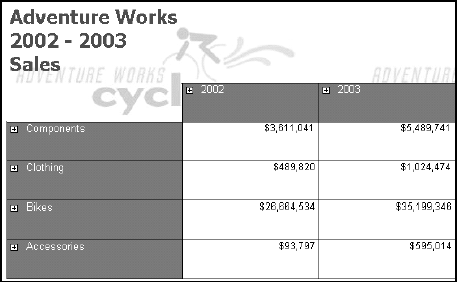
For example, Figure 3-1 shows a sample report retrieving company sales data from the AdventureWorks2008 database. It shows total sales for the years 2002 and 2003. Additionally, it breaks down the sales based on product categories.
Figure V.3-1. Adventure Works sales report.
However, an executive, manager, or other decision maker, might have the following questions based on this report:
Which quarter had the most sales?
Which quarter had the least sales?
Which bikes bring in the most revenue?
Are there any noticeable trends in any of the categories?
A matrix report presents the data in an intersecting format. The matrix report starts with summary data, but allows you to interact with the report and drill down into the more detailed data. A matrix report is also known as a cross-tab ...
Get Microsoft® SQL Server™ 2008 All-In-One Desk Reference For Dummies® now with the O’Reilly learning platform.
O’Reilly members experience books, live events, courses curated by job role, and more from O’Reilly and nearly 200 top publishers.

